Queue worker observability
Queue depth says how much work is waiting. Queue wait says what the backlog costs each job. Run duration says how long workers spend executing. Terminal outcomes and retry counts say whether the work eventually succeeds.
You need all four signals to distinguish a healthy traffic burst from a queue that is falling behind, a slow dependency, a retry storm, or a worker that disappeared.
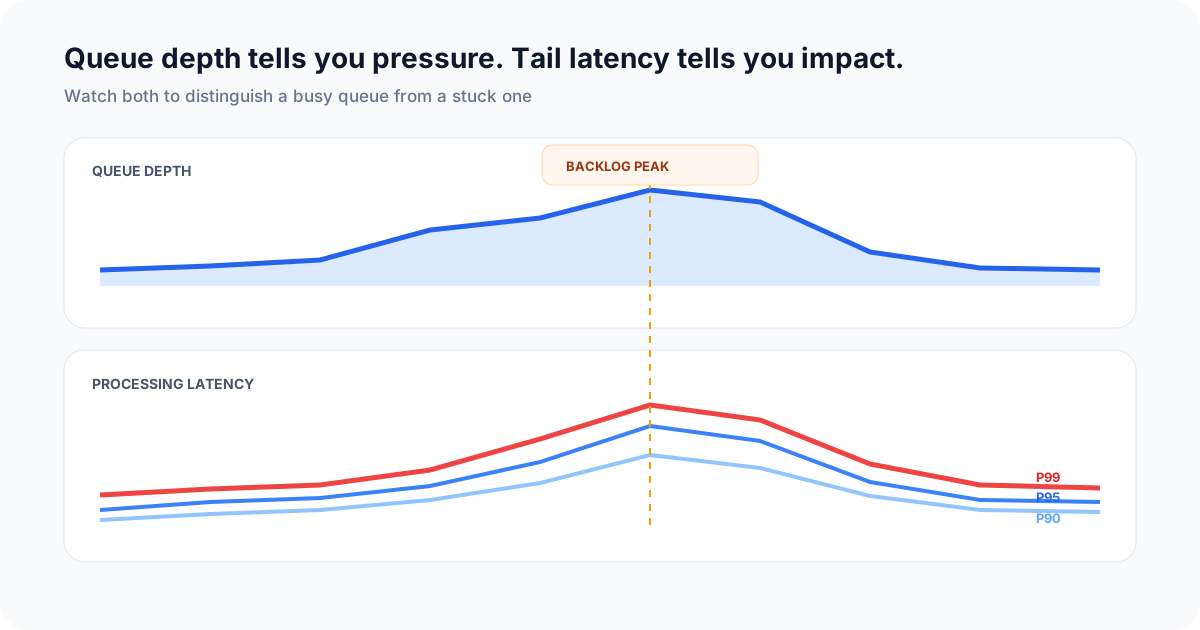
Tail percentiles expose the slow jobs that an average can smooth away.
Prerequisites
- A Telemetry API key
- A worker that exposes enqueue, start, and terminal outcome boundaries
- Stable logical job identifiers and low-cardinality job names
- An expected completion window for each critical job type
Model snapshots and outcomes separately
Use two event shapes because they answer different questions:
| Event | Grain | Use |
|---|---|---|
queue_snapshot |
One queue at one sampling time | Current depth, available workers, oldest waiting age |
background_job_completed |
One terminal outcome per logical job | Wait, run duration, retries, success, permanent failure |
A snapshot is sampled state, so do not sum its queue depth across time. A terminal outcome is completed work, so it cannot find a job that started and vanished. Add lightweight job_started and job_finished lifecycle events when stalled-job detection is required.
Define the terminal event contract
Use the background job completed schema as a starting point:
| Field | Meaning |
|---|---|
event_id |
Unique terminal event used for deduplication |
job_id |
Stable logical job identifier shared across attempts |
job_name |
Bounded job type, never a dynamic payload or ID |
queue_name |
Queue that executed the job |
account_id |
Pseudonymous account affected by the outcome |
attempt_count |
Total attempts including the terminal attempt |
queue_wait_ms |
Enqueue to first execution |
duration_ms |
Terminal attempt execution duration |
status |
success or permanent error |
release |
Worker or application version |
Keep job arguments, credentials, email addresses, document contents, and raw exception text out of the event. Use a bounded error_type if operators need failure categories.
Instrument the outcome boundary
Use Node.js 18+ with fetch and AbortSignal.timeout. Keep your ingest-only API key in trusted server configuration. This adapter uses the Log API directly to bound the export wait; the current JavaScript SDK does not expose a request timeout.
import { randomUUID } from "node:crypto";
Measure enqueue, first start, and terminal completion with the same clock. Emit one terminal row after success or retry exhaustion:
async function emitWorkerEventBestEffort(table, makeEvent) {
  try {
    const response = await fetch("https://api.telemetry.sh/log", {
      method: "POST",
      headers: {
        Authorization: process.env.TELEMETRY_API_KEY,
        "Content-Type": "application/json",
      },
      body: JSON.stringify({ table, data: makeEvent() }),
      signal: AbortSignal.timeout(2_000),
    });
    if (!response.ok) throw new Error("Worker telemetry export failed");
  } catch {
    try {
      console.error("Worker telemetry export failed");
    } catch {
      // Reporting failure must not replace the job's outcome.
    }
  }
}

async function processJob(job) {
  const startedAtMs = Date.now();
  let terminalAttemptStartedAtMs = startedAtMs;
  let attemptCount = 0;
  let result;

  const makeOutcome = (status) => {
    const finishedAtMs = Date.now();
    return {
      event_id: randomUUID(),
      job_id: job.id,
      job_name: job.name,
      queue_name: job.queue,
      account_id: job.accountId,
      attempt_count: attemptCount,
      queue_wait_ms: startedAtMs - job.enqueuedAtMs,
      duration_ms: finishedAtMs - terminalAttemptStartedAtMs,
      total_elapsed_ms: finishedAtMs - startedAtMs,
      status,
      ...(status === "error" ? { error_type: "job_failed" } : {}),
      release: process.env.APP_RELEASE ?? "unknown"
    };
  };

  try {
    result = await runWithRetry(async () => {
      attemptCount += 1;
      terminalAttemptStartedAtMs = Date.now();
      return performJob(job);
    });
  } catch (error) {
    await emitWorkerEventBestEffort(
      "background_job_completed", () => makeOutcome("error")
    );
    throw error;
  }

  await emitWorkerEventBestEffort(
    "background_job_completed", () => makeOutcome("success")
  );
  return result;
}
This is a server-side Node.js adapter. Supply performJob and runWithRetry from your worker: the retry helper must return the successful result or throw the final business error after exhaustion. performJob must complete the durable business change before returning. Event construction, export, and diagnostics are best effort and must not change that outcome. The HTTP send has a two-second abort deadline and can delay the worker by that wait. It provides no durable delivery queue or shutdown flush guarantee; an aborted request is not evidence of ingestion.
This example keeps the terminal attempt in duration_ms and the full retry-policy wall time in total_elapsed_ms. If your retry library reports these boundaries differently, adapt the timers while preserving the two documented meanings.
The telemetry call should follow the job's durable state change. Decide how your application handles telemetry delivery failures without turning an already successful job into a retry of its business side effect. Preserve event_id across a telemetry-delivery retry when the same terminal event is resent.
Sample queue state
Collect snapshots on a fixed interval from the queue's authoritative state:
async function recordQueueSnapshot(queue) {
  const state = await queue.inspect();
  await emitWorkerEventBestEffort("queue_snapshot", () => {
    const observedAtMs = Date.now();
    const oldestAtMs = state.oldestEnqueuedAtMs;
    return {
    event_id: randomUUID(),
    queue_name: queue.name,
    depth: state.waitingCount,
    active_workers: state.activeWorkers,
    oldest_wait_ms: state.waitingCount === 0 ? 0
      : Number.isFinite(oldestAtMs) && oldestAtMs <= observedAtMs
        ? observedAtMs - oldestAtMs
        : null,
    release: process.env.APP_RELEASE ?? "unknown"
    };
  });
}
For a nonempty queue, a missing or future enqueue time produces null, meaning unknown age. Only an empty queue has a known zero wait.
Keep the interval frequent enough to detect a meaningful backlog but not so frequent that identical samples dominate event volume. Record zero depth as zero; do not omit it.
Separate queue wait from run time
This query compares typical and tail wait with tail execution duration:
SELECT
  job_name,
  COUNT(*) AS jobs,
  approx_percentile_cont(queue_wait_ms, 0.50) AS p50_wait_ms,
  approx_percentile_cont(queue_wait_ms, 0.95) AS p95_wait_ms,
  approx_percentile_cont(duration_ms, 0.95) AS p95_run_ms
FROM background_job_completed
WHERE timestamp_utc >= now() - INTERVAL '24 hours'
GROUP BY job_name
HAVING COUNT(*) >= 20
ORDER BY p95_wait_ms DESC;
A high p95 wait with normal run time points toward capacity, scheduling, prioritization, or burst handling. High run time with normal wait points toward job code or a dependency. Both rising together can mean the slow work is consuming worker capacity and creating a backlog.
Measure retries and terminal failures
Each terminal row represents one logical job. attempt_count > 1 means the job was retried, including jobs that still ended in permanent failure. Require status = 'success' as well when measuring recovery after a retry:
SELECT
  job_name,
  COUNT(*) AS jobs,
  SUM(CASE WHEN attempt_count > 1 THEN 1 ELSE 0 END) AS retried_jobs,
  SUM(CASE WHEN status = 'error' THEN 1 ELSE 0 END) AS permanent_failures,
  100.0 * SUM(CASE WHEN attempt_count > 1 THEN 1 ELSE 0 END)
    / NULLIF(COUNT(*), 0) AS retried_job_rate_pct,
  100.0 * SUM(CASE WHEN status = 'error' THEN 1 ELSE 0 END)
    / NULLIF(COUNT(*), 0) AS permanent_failure_rate_pct
FROM background_job_completed
WHERE timestamp_utc >= now() - INTERVAL '7 days'
GROUP BY job_name
ORDER BY permanent_failure_rate_pct DESC, retried_job_rate_pct DESC;
If you emit one row per attempt instead, use an attempt field and a stable job_id; the denominator and interpretation will be different. Document the row grain beside every query so retries are not accidentally counted as separate customer jobs.
Detect stalled and lost work
A terminal-only table cannot distinguish a long-running job from one lost after a worker crash. Emit job_started plus job_completed or job_failed with the same job_id, then use a left join to find starts without a terminal event.
The threshold must be job-specific or derived from an expected completion window. Long-running jobs may need heartbeat events. Add a short grace period for event-delivery lag so the newest rows do not create false positives.
Use the complete stalled background jobs query rather than treating queue depth as proof that a particular job is stuck.
Account for dead letters, priorities, and shutdowns
Record a distinct terminal category or event when retry policy is exhausted and a job enters a dead-letter queue. Track replay as a new operational action linked to the original job_id; do not silently rewrite the original failure.
Segment capacity signals by queue or priority when workers are not interchangeable. A healthy bulk queue can hide a blocked critical queue in an overall average.
During deploys and shutdowns:
- stop accepting new work before terminating workers;
- allow a documented drain interval;
- distinguish an intentional requeue from an execution failure;
- preserve the logical
job_idand increment attempt state; - verify every started job eventually produces a terminal event.
Build the dashboard
The background jobs dashboard example provides the SQL, synthetic result, and interpretation. A production dashboard should include:
- current queue depth and oldest waiting age by queue;
- p50 and p95 queue wait by job name;
- p95 execution duration by job name;
- retried-job and permanent-failure rates;
- current stalled jobs with safe correlation identifiers;
- volume by release so a deployment can be compared with the change.
Use complete time buckets for trends. Set minimum-volume rules before ranking rates. A single failed job in a quiet queue is operationally important only when that workflow is critical; otherwise it should not outrank a high-volume regression by percentage alone.
Define the response to each alert
Tie each alert to an owner and action:
| Condition | Likely question | First response |
|---|---|---|
| Depth and oldest wait rise | Is demand exceeding capacity? | Check arrival rate, workers, priority, and dependency health |
| Run time rises while wait is stable | Did job code or a dependency slow down? | Compare release and error category |
| Retry rate rises | Is transient failure amplifying work? | Inspect bounded error types and provider health |
| Permanent failures rise | Is recovery exhausted? | Identify affected accounts and dead-letter state |
| Start has no terminal event | Did a worker crash or instrumentation disappear? | Inspect the worker, heartbeat, and job state |
Avoid paging on one incomplete bucket. Require a sustained breach or a critical terminal failure, and keep the threshold aligned with the workflow's expected completion time.
Validate before production
Run a fixture for:
- first-attempt success;
- retry followed by success;
- permanent failure and dead-letter entry;
- duplicate event delivery;
- worker crash after
job_started; - long-running job with a heartbeat;
- a queue burst that drains normally;
- a deployment shutdown and requeue.
Confirm logical-job counts, attempt counts, queue wait, run duration, missing terminal events, and affected-account counts. Also verify that telemetry failure cannot replay a non-idempotent business operation.
Next steps
Continue with the queue wait recipe, background job retry-rate recipe, stalled background jobs recipe, and background job monitoring use case.