Application telemetry: a practical guide
Application telemetry records what software did, who it affected, how long it took, and whether it succeeded. When teams use the same event definitions, they can compare results without parsing separate log messages.
This guide shows how to choose the right signal, design safe outcome events, deliver them, validate them with SQL, and turn them into dashboards and alerts.
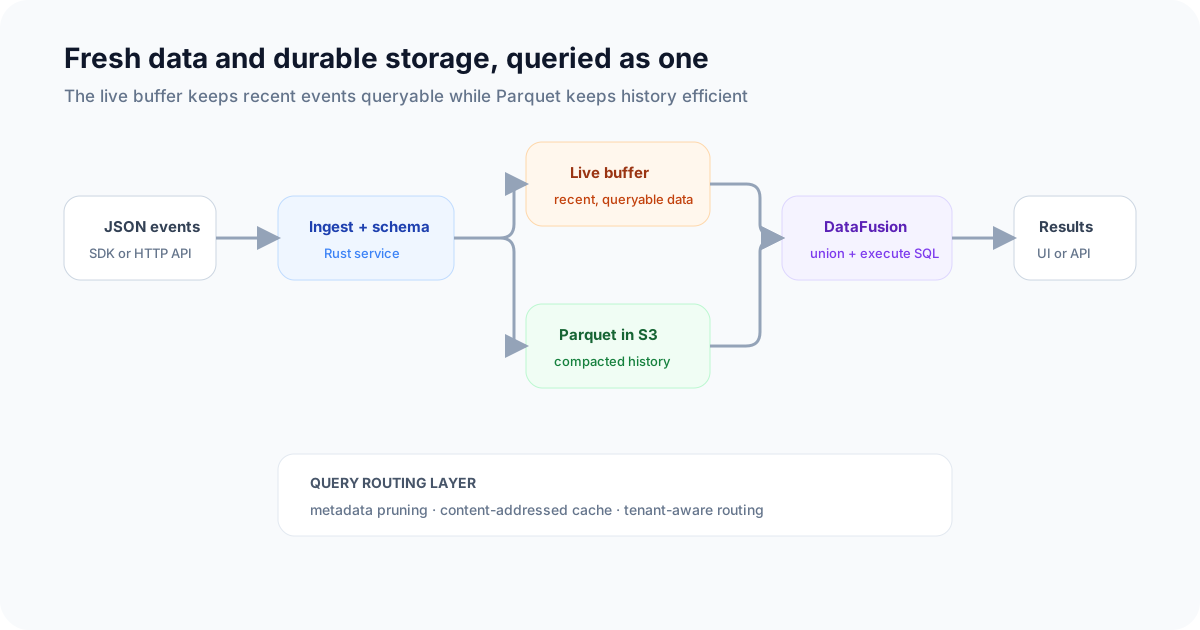
A useful application event stays structured from the emit boundary through storage and SQL analysis.
What application telemetry includes
Logs, metrics, traces, and structured events overlap. Choose the signal that answers your question:
| Signal | Best at | Typical question |
|---|---|---|
| Structured event | Durable business or application outcome | Which accounts failed to activate after signup? |
| Log | Detailed diagnostic record | What did this process report around one failure? |
| Metric | Cheap aggregate trend | Is request volume or CPU changing? |
| Trace | Causal path through distributed work | Which span made this request slow? |
Do not force one signal to replace every other one. A terminal api_request_completed event can hold the route, account, status, duration, and release needed for an error-rate dashboard. A trace can explain which dependency consumed that duration. A diagnostic log can preserve a reviewed technical message. An infrastructure metric can show whether the service was resource constrained.
The shared identifiers between those signals are often more valuable than duplicating their full payloads.
Start with a decision
Instrumentation should begin with a question and an action:
- Question: Which API routes are failing for the most accounts after a release?
- Decision: Roll back, disable a feature, or investigate a dependency.
- Event:
api_request_completed. - Grain: One completed request.
- Dimensions: route template, method, status code, error category, release.
- Measurements: latency in milliseconds.
- Safe correlation: request and account identifiers.
If a field will not be used by a known filter, group, calculation, join, investigation, or policy, leave it out. "It might be useful later" creates cost, privacy risk, and unstable schemas without guaranteeing a useful answer.
Design one event contract
A terminal request event might look like this:
{
  "event_id": "evt_api_01",
  "request_id": "req_2f71",
  "account_id": "acct_8f31",
  "route": "/v1/query/:id",
  "method": "POST",
  "status_code": 200,
  "latency_ms": 184,
  "error_type": null,
  "release": "2026.07.3"
}
The contract should state:
| Property | Definition |
|---|---|
| Event name | Stable, past-tense outcome such as api_request_completed |
| Grain | Exactly what one row represents |
| Emit boundary | The application state change after which the outcome is final |
| Owner | Team or service responsible for the producer |
| Required fields | Values every accepted row must have |
| Controlled values | Allowed statuses, categories, methods, or versions |
| Units | _ms, _bytes, _usd, or another explicit suffix |
| Privacy class | Non-sensitive, pseudonymous, or requiring review |
| Retention need | How long the decision requires the data |
Use route templates such as /v1/query/:id, not raw URLs that turn every identifier into a new dimension. Use a bounded error_type, not a stack trace. Keep numeric measurements numeric and stable identifiers string-typed.
Emit at the outcome boundary
Record an outcome only when it is known. For an HTTP request, that is usually after the final status and duration are available:
import telemetry from "telemetry-sh";

telemetry.init("YOUR_API_KEY");

async function recordRequest(context, response, startedAtMs) {
  await telemetry.log("api_request_completed", {
    event_id: crypto.randomUUID(),
    request_id: context.requestId,
    account_id: context.accountId,
    route: context.routeTemplate,
    method: context.method,
    status_code: response.status,
    latency_ms: Date.now() - startedAtMs,
    error_type: response.error
      ? classifyRequestError(response.error)
      : null,
    release: process.env.APP_RELEASE ?? "unknown"
  });
}
Telemetry removes null values during normalization, so a successful row stores no error_type. The query layer provides timestamp_utc; a client-provided field with that name is removed. See the Log API for the exact accepted shapes and normalization rules.
Do not let a telemetry delivery failure change a completed business outcome into a duplicate payment, email, job, or request. Decide whether to buffer, retry, sample, or drop according to the workflow's risk. Reuse the same event_id when retrying delivery of the same logical event.
Choose identifiers for correlation
Use identifiers that match the entity being investigated:
event_iddeduplicates one telemetry event;request_idlinks application evidence for one request;job_idconnects lifecycle events and retry attempts;account_idmeasures customer impact;user_idsupports actor-level product analysis when approved;trace_idlinks to a distributed trace.
Keep identifiers pseudonymous. An email address, access token, session cookie, prompt, document, or full URL is not a convenient identifier; it is sensitive payload data.
Control cardinality and payload size
Cardinality is the number of distinct values a field produces. High-cardinality IDs are useful for investigation and joins, but poor default dashboard groups. Unbounded text is rarely a safe analytical dimension.
Use:
route: "/v1/query/:id"instead of/v1/query/9be1...;error_type: "upstream_timeout"instead of the exception message;- an approved provider model identifier instead of an ad hoc display label;
release: "2026.07.3"instead of a full deployment manifest.
Group on bounded fields. Select identifiers only in restricted investigation results. Omit request and response bodies rather than trying to redact every possible sensitive value after ingestion.
Keep types and meanings stable
Event flexibility is not a reason to send mixed types. latency_ms must not alternate between 184, "184 ms", and "slow". account_id must not refer to a user in one service and an organization in another.
Additive optional fields are usually the safest evolution. A rename, unit change, type change, or new row grain needs a migration or new event version. Follow the schema evolution guide and measure field adoption by release before changing a dashboard or alert.
Nested objects can create useful namespaces, but every dotted path is still a contract. See querying nested JSON.
Separate event time and ingestion time
Define when the business or application outcome happened. Delayed mobile clients, queues, offline agents, and retry buffers can deliver later than that moment.
For server-generated online events, Telemetry's managed timestamp_utc is often the correct operational query time. If your workflow needs a source event time, send a separately named timezone-qualified timestamp and document how late arrivals affect reports. Do not compare partial current buckets with complete historical buckets.
The working with timestamps guide covers UTC, windows, and late-arriving data.
Query the first useful question
Start with a bounded sample:
SELECT
  timestamp_utc,
  route,
  status_code,
  latency_ms,
  release
FROM api_request_completed
WHERE timestamp_utc >= now() - INTERVAL '1 hour'
ORDER BY timestamp_utc DESC
LIMIT 100;
Then calculate volume, error rate, affected accounts, and tail latency:
SELECT
  route,
  COUNT(*) AS requests,
  SUM(CASE WHEN status_code >= 500 THEN 1 ELSE 0 END) AS errors,
  COUNT(DISTINCT CASE
    WHEN status_code >= 500 THEN account_id
  END) AS affected_accounts,
  100.0 * SUM(CASE WHEN status_code >= 500 THEN 1 ELSE 0 END)
    / NULLIF(COUNT(*), 0) AS error_rate_pct,
  approx_percentile_cont(latency_ms, 0.95) AS p95_latency_ms
FROM api_request_completed
WHERE timestamp_utc >= now() - INTERVAL '24 hours'
GROUP BY route
HAVING COUNT(*) >= 20
ORDER BY affected_accounts DESC, error_rate_pct DESC;
The minimum-volume rule keeps a single quiet failure from automatically outranking a busy regression. A critical low-volume workflow may need its own alert rather than a generic leaderboard.
Build a decision-ready dashboard
An application reliability dashboard should let a reader move from detection to scope and evidence:
- request or workflow volume;
- success or error rate over complete time buckets;
- p50 and p95 latency;
- affected accounts;
- breakdown by route, error category, and release;
- a restricted table with request IDs for investigation.
Annotate units, time range, denominator, minimum volume, data freshness, and the event contract. Keep a synthetic result or known fixture beside important SQL so a reviewer can tell what the query is intended to return.
Use the API reliability dashboard example and API latency recipe as complete starting points.
Alert only when an owner can respond
An alert definition needs the query, exact denominator, complete time window, threshold or baseline, minimum volume, owning team, runbook, first diagnostic breakdown, and behavior for missing data.
For example: notify the API owner when p95 latency exceeds the route objective for three complete buckets and at least 100 requests were observed. The response begins by comparing release, error category, and affected-account count.
Monitor the telemetry pipeline itself. A flat zero can mean a quiet application, a broken producer, a delivery failure, or a query error. The telemetry delivery event schema and ingestion freshness recipe make missing evidence visible.
Protect privacy and security
Collect the minimum evidence required for the decision. Before release:
- classify every identifier and free-text field;
- remove secrets, credentials, cookies, request bodies, prompts, and generated content;
- use pseudonymous internal IDs;
- restrict investigation views that expose actor or resource identifiers;
- set retention from a documented operational or product need;
- test redaction and failure branches, not just successful requests;
- review deletion and access requirements for the data's jurisdiction and use.
Read redacting sensitive data and the security overview before expanding the payload.
Validate the entire path
A producer unit test is necessary but not sufficient. Validate:
- the success, failure, timeout, retry, and duplicate branches;
- field names, types, units, and controlled values;
- API acceptance and error handling;
- a recent raw row in the destination table;
- the aggregate SQL against a known fixture;
- the dashboard's time window and denominator;
- the alert's threshold, owner, and missing-data behavior;
- the rollback path with the prior producer version.
Track field coverage and event volume by release after deployment. A code path existing in source does not prove that production is emitting complete events.
Control cost without losing the outcome
Estimate volume before broad rollout:
events per day
  = requests per day
  × events per request
  × retained sample fraction
Prefer one terminal outcome event over several redundant progress events when the intermediate states are not used. Sample high-volume successful diagnostics only after preserving the denominator needed for rates. Keep failures and rare critical outcomes when policy allows, but do not use sampling as a substitute for removing sensitive data.
Align retention with the longest comparison or investigation window that has a documented owner. A field or event no one queries should be removed from the plan before it becomes permanent cost.
Application telemetry rollout checklist
- Write the question, decision, owner, and expected response.
- Define one row's grain and the exact outcome boundary.
- Choose required fields, controlled values, units, and safe identifiers.
- Classify privacy, cardinality, retention, and volume.
- Add representative success, failure, retry, duplicate, and rollback fixtures.
- Instrument delivery without changing business-operation semantics.
- Verify accepted rows and required-field coverage by release.
- Test SQL against a known result.
- Publish the dashboard definition, freshness, and denominator.
- Add an alert only when the owner and response are clear.
- Monitor the telemetry pipeline itself.
- Review fields after the first retention window and remove unused data.
Continue with designing an event schema, structured logging, the event schema catalog, and the end-to-end SaaS observability demo.