Quick start
Send JSON events to Telemetry and query them with SQL. This quick start sends one event, checks the table Telemetry creates, and runs a query.
The examples below use fictional data in the reserved telemetry_quickstart table. They check the send and query path; to finish integrating your app, run one real workflow and query the event it produces.
Read about storage and query execution in Telemetry architecture. For a complete instrumentation example, see tracking OpenAI costs.
Prefer a shorter task-by-task path? Follow:
- Send Your First Structured Event
- Verify Event Ingestion and Schema
- Write Your First Telemetry SQL Query
- Create Your First Dashboard and Alert
- Production Instrumentation Checklist
Get your API key
Visit the homepage to get an anonymous key in a ready-to-copy setup prompt. Use that anon_… key in the examples below; no account is needed to send your first event and query it. If you already have an account, use a read-and-write key from Team Settings → API Keys.
Anonymous queries work for 24 hours after the first event. Create an account within 7 days to keep your events and the same key. Signup remembers the trial in this browser. In another browser, select Already have an anonymous API key?, paste the key, and choose Find my data before registering. Existing users can recover the key at Keep my data, then log in. A trial with no events expires 7 days after creation.
Install Telemetry
This tutorial uses JavaScript. You can also use the Python SDK, Go SDK, Rust SDK, Ruby SDK, PHP SDK, or cURL.
npm install telemetry-sh
Log some data
Telemetry automatically creates tables when data is logged. In the following example, we log synthetic ride data to a table called telemetry_quickstart. Telemetry creates the table and its schema with city and price; every row also receives timestamp_utc.
import telemetry from "telemetry-sh";

telemetry.init("YOUR_API_KEY");

await telemetry.log("telemetry_quickstart", {
  city: "paris",
  price: 42
});
Await the send before querying so delivery errors are visible. The query result below is the check that the event actually reached the table; a send response alone is not that proof.
Explore data with our UI
First, verify the event without signing up:
const result = await telemetry.query("SELECT city, price FROM telemetry_quickstart WHERE city IS NOT NULL LIMIT 10");
console.log(result);
To explore your events with charts, dashboards, and alerts, create an account and keep your data. Your existing key continues working, and registration opens the workspace containing your events. If you already have an account, link your trial.
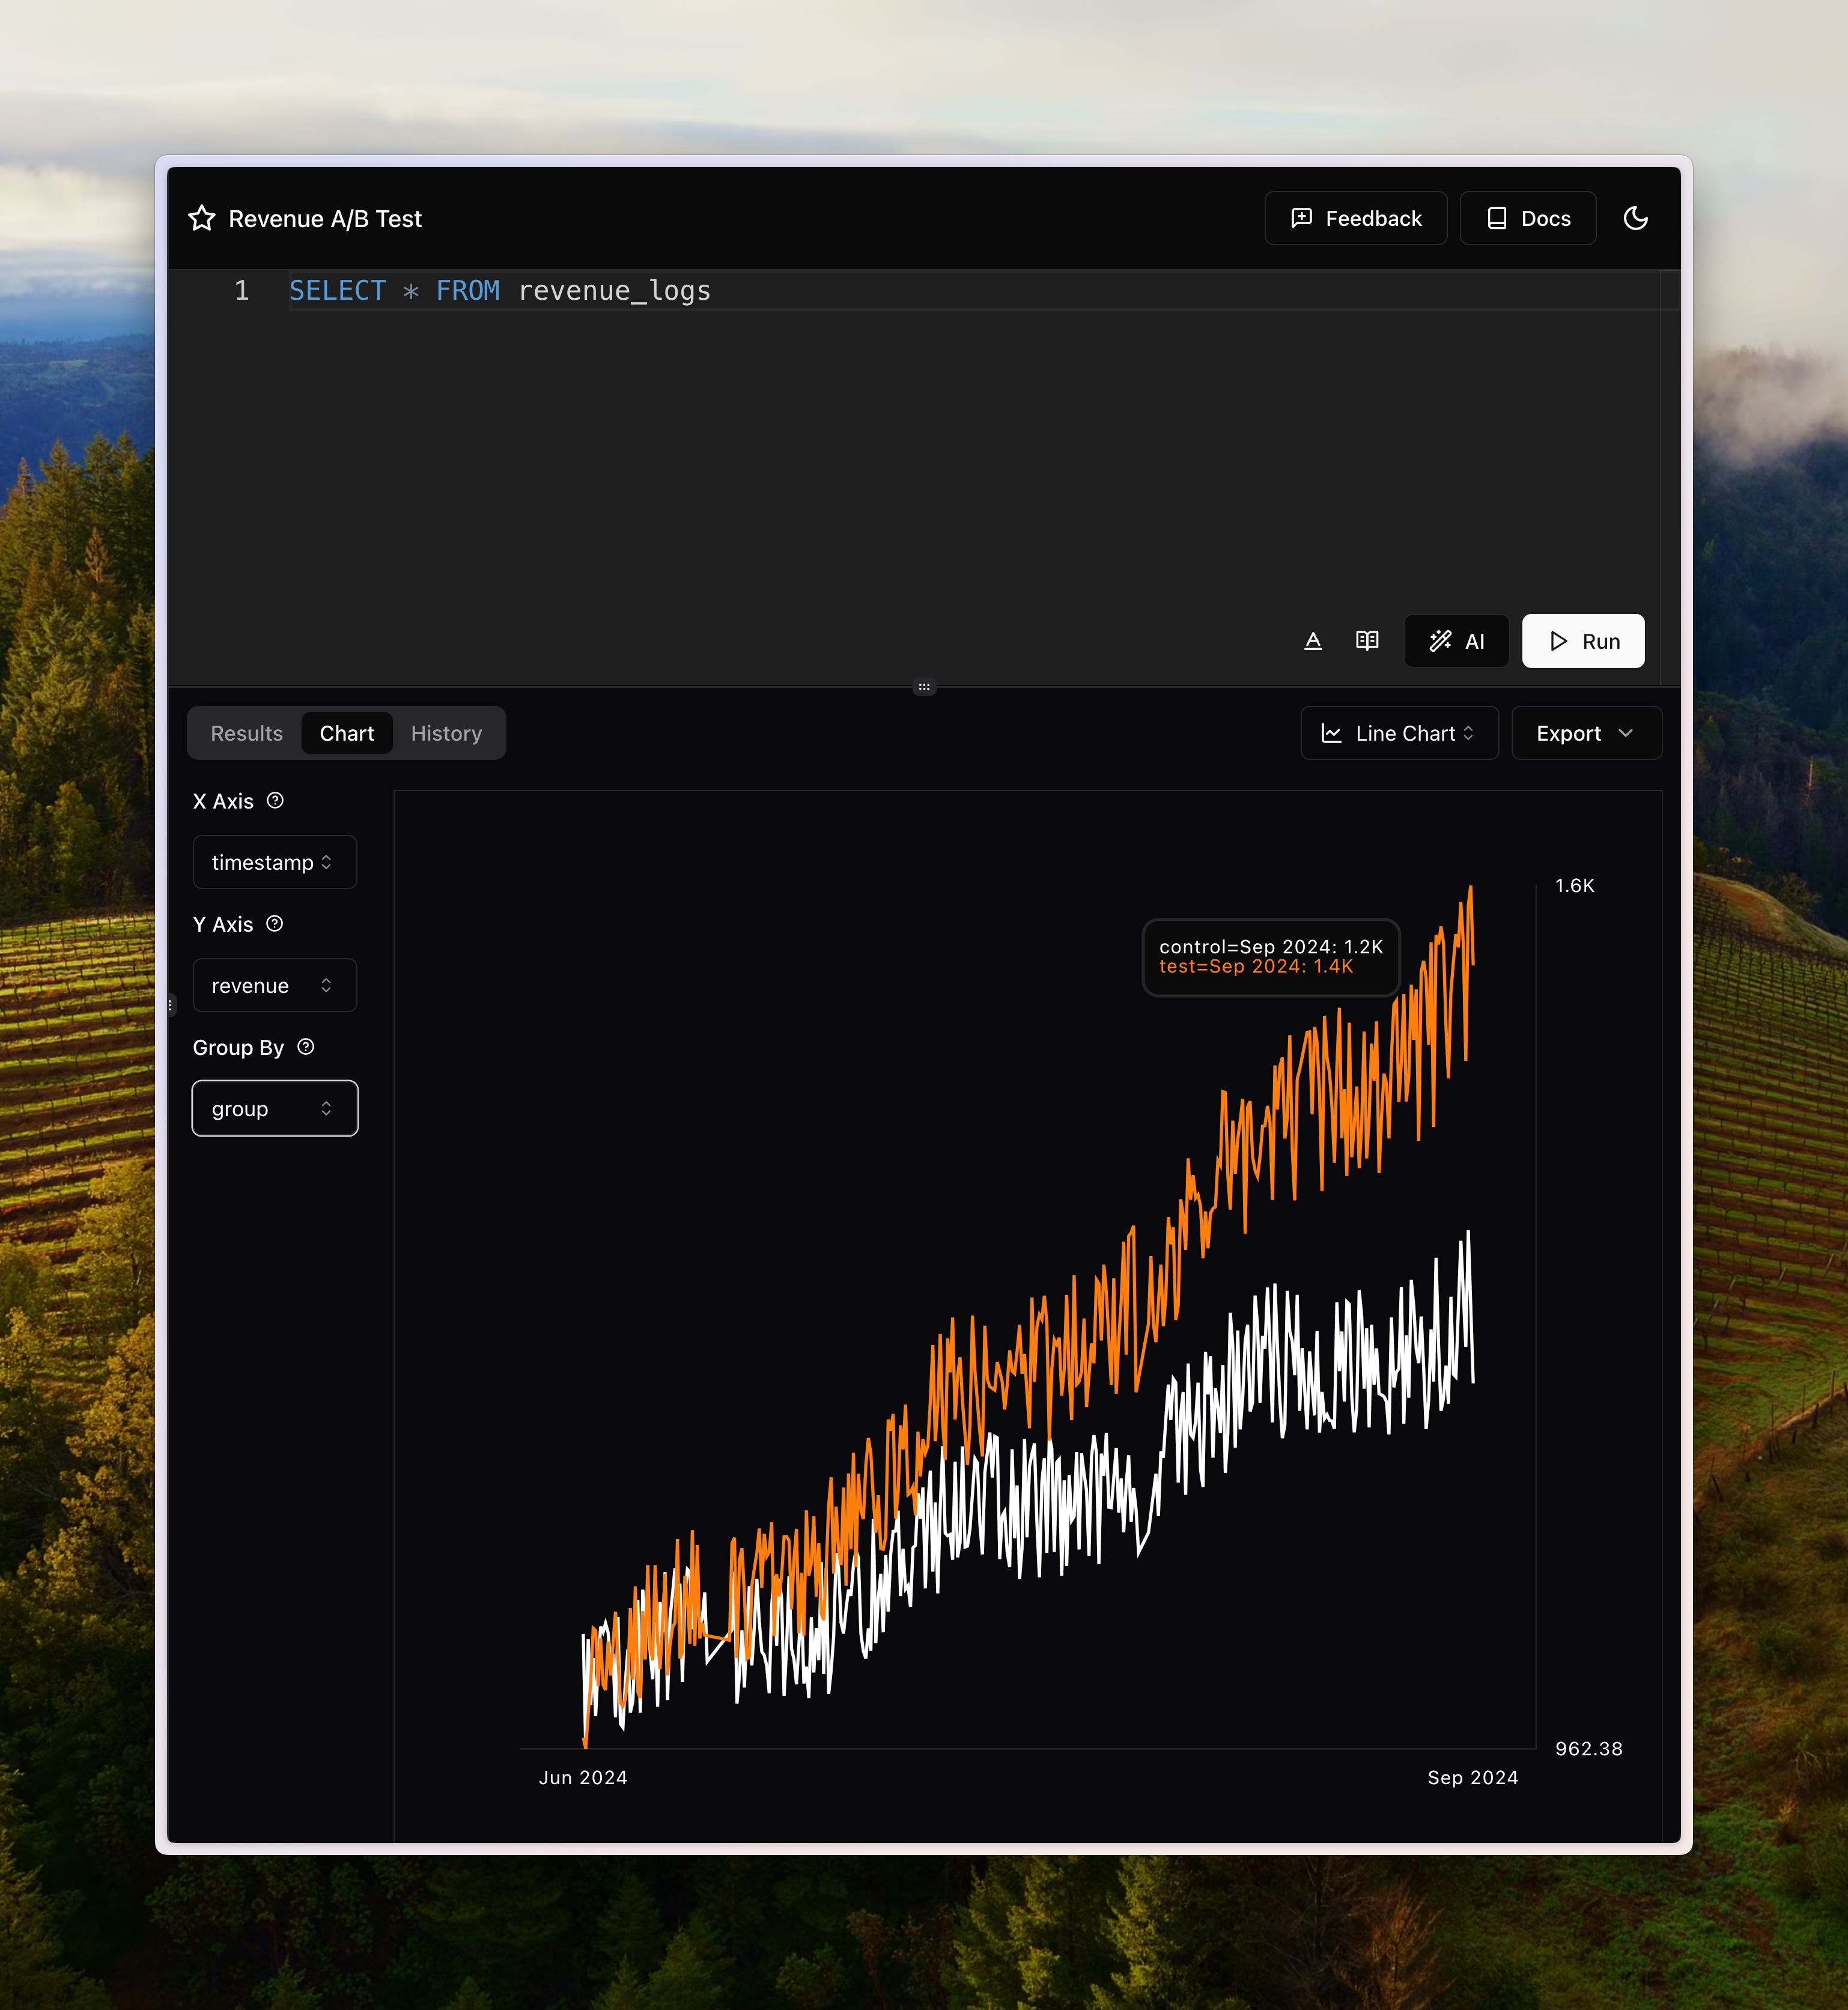
A separate, larger synthetic ride dataset shows counts and average prices by city, with the Save this result prompt below the SQL editor.
Save this result saves the query output to the dashboard named in the prompt. The dashboard and alert steps below explain the other result actions.
Explore view
Use the Explore tab to filter events and build charts or tables without writing SQL.
Explore works with one table at a time. To open it:
- Go to your team.
- Open Tables.
- Select a table.
- Open the Explore tab on that table page.
Route shape:
/team/{team}/table/{table}?tab=explore
- Pick a graph type,
Samples,Table,Line,Bar, orStacked Area. - Set a time range and add one or more filters.
- Choose columns to include. You can use nested fields like
data.toolName. - Click Run to execute and render results.
Tip: controls are draft state. Results update only when you click Run.
Synthetic example dataset
The Explore examples use synthetic test events with this structure:
{
  "timestamp_utc": "2026-02-27T12:00:00.000Z",
  "event": "tool_call",
  "status": "success",
  "data": {
    "toolName": "smart_avantis_buy",
    "args": {
      "symbol": "BTC-USD",
      "amountUsd": 2500
    }
  }
}
This illustrates a stored row. When sending the event to telemetry_quickstart, omit timestamp_utc: Telemetry generates it from timestamp, which defaults to the current UTC time when omitted. The date above is illustrative. To send a historical event, set timestamp instead and select a time range that includes it in Explore. See Log API normalization.
Example 1: Filter tool calls and inspect raw rows
Using the fictional schema above, try this in Explore:
- Set graph type to
Samples. - Add filter:
event = tool_call. - Add filter:
data.toolName = smart_avantis_buy. - Click Run.
URL template. Replace the placeholders:
/team/{team}/table/telemetry_quickstart?tab=explore&graphType=samples&f=event:=:tool_call&f=data.toolName:=:smart_avantis_buyExample 2: Compare chart view vs table view
Use the same filters, then:
- Select
Lineand click Run. - Switch to
Tableand click Run again.
This gives you a quick way to validate both trends and exact values.
Example 3: Nested columns in All Columns mode
When you keep All columns selected in Explore, generated SQL explicitly enumerates columns so nested fields are included.
Example generated SQL shape:
SELECT "timestamp_utc", "event", "data.toolName", "data.args.symbol"
FROM "your_table"
WHERE timestamp_utc >= now() - INTERVAL '7 days'
ORDER BY timestamp_utc DESC
LIMIT 200
Dashboards
Dashboards let you pin Explore charts/tables and query results into one shared view.
To create and use dashboards:
- Open any table in Explore or open a saved query result.
- Save the result with Save to Getting Started, the corresponding dashboard name, or Save this result.
- If no dashboard exists, use Create starter dashboard & save.
- To select another destination or enter a widget title, use Choose dashboard when multiple dashboards are available.
Dashboard route shape:
/team/{team}/dashboard/{dashboardSlug}
Use a dashboard to compare latency, error rates, cost, and conversion metrics in one place.
Create alerts
Once you have a chart or query result, you can turn it into an alert in the Telemetry UI.
- Open a table in Explore or run a query in Results/Chart view.
- Click Monitor result or Monitor this result to open alert settings.
- Configure the aggregation, last N points, comparison, and threshold.
- Set a check interval and one or more email recipients.
- Click Create Alert to save. You will be redirected to
/team/{team}/alert/{alertSlug}to monitor status and history.
Tip: leave Ignore the last data point enabled for bucketed time series, since the newest bucket is often incomplete.
For a full walkthrough, see the Alerts guide.
Interactive inline examples
Example 1: Detect p95 latency spikes
Try this in Explore on a table with latency_ms:
- Set graph type to
Line. - Set aggregation to
p95with metriclatency_ms. - Click Run, then click Monitor result.
- Condition:
p95 of last 5 data points is Greater than 850. - Interval:
Every minute, then add recipient emails.
URL template. Replace the placeholders:
/team/{team}/table/{table}?tab=explore&graphType=line&agg=p95&metric=latency_ms&time=7dExample 2: Detect a rise in error counts
Use a table of HTTP request events with a numeric status_code field to count server errors (HTTP 5xx). The earlier tool-call example uses a text status field; it cannot supply this filter.
- In Explore, filter rows with
status_code >= 500andstatus_code < 600. - Use a line chart with aggregation
count. - Click Monitor result or Monitor this result.
- Condition:
Average of last 3 data points is Greater than 20.
This catches short error bursts while avoiding noise from a single bad bucket.
Example 3: Detect traffic below a threshold
Use this for cron jobs, queues, or ingest pipelines:
- Query or chart event volume over time.
- Create an alert with comparison
Less than. - Condition:
Sum of last 10 data points is Less than 50.
If this triggers, it usually means data stopped flowing before customers notice.
Integrate with your codebase
The query API can read these fictional ride events from code. For your product or internal dashboard, replace this sample table with events from a workflow you actually ran.
const results =
  await telemetry.query(`
    SELECT
      city,
      AVG(price)
    FROM
      telemetry_quickstart
    WHERE city IS NOT NULL
    GROUP BY
      city
  `);
Browse the SQL recipe library when you are ready to analyze API errors, latency percentiles, job retries, LLM cost, conversion, retention, or missing heartbeats.
For the architecture and analysis model behind those recipes, continue with SQL for Observability and Event Analytics. To run one complete synthetic workflow from ingestion through a SQL result, use the end-to-end SaaS observability demo.