OpenAI API cost tracking by model and feature
To track OpenAI API costs, record token usage, model, latency, retries, and an estimated request cost alongside the product feature and customer that caused the call. This turns an unexplained provider invoice into spend you can query by model, feature, team, and outcome.
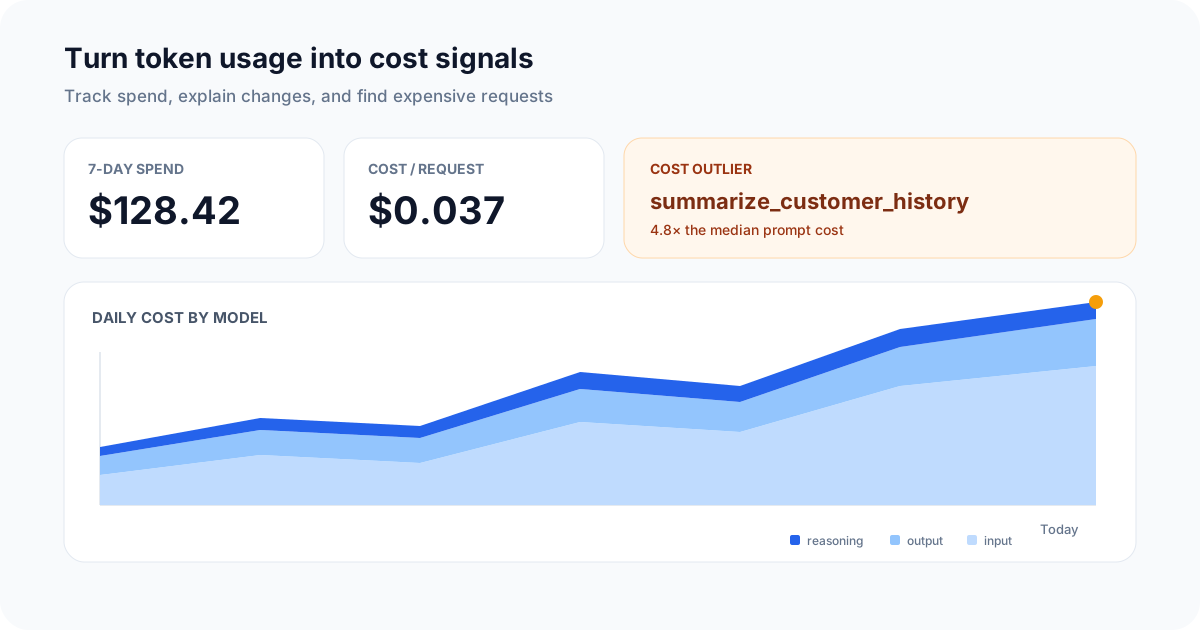
Request-level telemetry connects the cost trend to the model and workload that caused it.
The most useful event combines provider usage with product context. Token counts explain consumption; fields such as feature, team_id, status, and accepted explain whether the request produced value.
See an OpenAI cost dashboard in under a minute
Start with a free sample OpenAI usage event. The quickstart creates a clearly marked event, opens a ready-to-run cost query, and keeps the result on your Getting Started dashboard. You can inspect the workflow before changing application code.
The generated sample uses the minimum useful cost shape:
{
  "provider": "openai",
  "model": "gpt-5",
  "input_tokens": 1250,
  "output_tokens": 340,
  "cost_usd": 0.0184,
  "latency_ms": 842,
  "status": "ok",
  "sample": true
}
Run this immediately against the generated telemetry_quickstart table:
SELECT
  model,
  COUNT(*) AS requests,
  SUM(input_tokens) AS input_tokens,
  SUM(output_tokens) AS output_tokens,
  ROUND(SUM(cost_usd), 4) AS total_cost_usd,
  ROUND(AVG(latency_ms), 0) AS average_latency_ms
FROM telemetry_quickstart
WHERE provider = 'openai'
GROUP BY model
ORDER BY total_cost_usd DESC;
Prerequisites
- A Telemetry API key
- An OpenAI API key
- Node.js and the official OpenAI JavaScript SDK
1. Install and initialize the SDKs
npm install openai telemetry-sh
import OpenAI from "openai";
import telemetry from "telemetry-sh";

const openai = new OpenAI();
telemetry.init(process.env.TELEMETRY_API_KEY);
Keep both API keys in server-side environment variables. Do not put them in source control or browser code.
2. Keep pricing outside the instrumentation
OpenAI pricing and model availability can change. Read the current rates from the official OpenAI pricing page and store the rates you use in configuration.
This example uses USD per one million tokens:
OPENAI_MODEL="YOUR_MODEL"
OPENAI_INPUT_USD_PER_MILLION="YOUR_CURRENT_INPUT_RATE"
OPENAI_CACHED_INPUT_USD_PER_MILLION="YOUR_CURRENT_CACHED_INPUT_RATE"
OPENAI_CACHE_WRITE_USD_PER_MILLION="YOUR_CURRENT_CACHE_WRITE_RATE"
OPENAI_OUTPUT_USD_PER_MILLION="YOUR_CURRENT_OUTPUT_RATE"
OPENAI_PRICING_VERSION="provider-price-sheet-reviewed-YYYY-MM-DD"
const pricing = {
  inputUsdPerMillion: Number(process.env.OPENAI_INPUT_USD_PER_MILLION),
  cachedInputUsdPerMillion: Number(
    process.env.OPENAI_CACHED_INPUT_USD_PER_MILLION
  ),
  cacheWriteUsdPerMillion: Number(
    process.env.OPENAI_CACHE_WRITE_USD_PER_MILLION
  ),
  outputUsdPerMillion: Number(process.env.OPENAI_OUTPUT_USD_PER_MILLION),
};

function estimateCostUsd({
  inputTokens,
  cachedInputTokens,
  cacheWriteTokens,
  outputTokens,
}) {
  const uncachedInputTokens = Math.max(
    0,
    inputTokens - cachedInputTokens - cacheWriteTokens
  );

  return (
    (uncachedInputTokens * pricing.inputUsdPerMillion +
      cachedInputTokens * pricing.cachedInputUsdPerMillion +
      cacheWriteTokens * pricing.cacheWriteUsdPerMillion +
      outputTokens * pricing.outputUsdPerMillion) /
    1_000_000
  );
}
Use your provider invoice as the billing source of truth. Cached input, reasoning tokens, batch processing, tools, images, audio, or other model features can require additional fields and pricing rules.
Do not silently substitute the standard input rate when a cached-read or cache-write rate is unknown. Mark the estimate incomplete until the current provider price sheet has been reviewed. Key pricing configuration by provider, model, service tier, and effective time rather than overwriting it in place.
3. Instrument a responses API request
The current OpenAI JavaScript SDK exposes the Responses API through client.responses.create. A completed response includes a usage object with input_tokens, output_tokens, and total_tokens.
async function logAiRequestWithoutChangingOutcome(table, event) {
  try {
    await telemetry.log(table, event);
  } catch {
    try {
      console.error("AI request telemetry send failed");
    } catch {
      // Diagnostics must not replace the application's result or error.
    }
  }
}

async function createDraftReply({ input, teamId, userId, attempt = 1 }) {
  const model = process.env.OPENAI_MODEL;
  const startedAt = Date.now();
  let response;

  try {
    response = await openai.responses.create({
      model,
      input,
    });
  } catch (error) {
    await logAiRequestWithoutChangingOutcome("llm_request_failed", {
      provider: "openai",
      model,
      feature: "draft_reply",
      team_id: teamId,
      user_id: userId,
      status: "error",
      attempt,
      error_type: error?.constructor?.name ?? "unknown_error",
      latency_ms: Date.now() - startedAt,
    });

    throw error;
  }

  const inputTokens = response.usage?.input_tokens ?? 0;
  const outputTokens = response.usage?.output_tokens ?? 0;
  const cachedInputTokens =
    response.usage?.input_tokens_details?.cached_tokens ?? 0;
  const cacheWriteTokens =
    response.usage?.input_tokens_details?.cache_write_tokens ?? 0;
  const reasoningTokens =
    response.usage?.output_tokens_details?.reasoning_tokens ?? 0;
  const estimatedCostUsd = estimateCostUsd({
    inputTokens,
    cachedInputTokens,
    cacheWriteTokens,
    outputTokens,
  });

  await logAiRequestWithoutChangingOutcome("llm_request_completed", {
    response_id: response.id,
    provider: "openai",
    model: response.model ?? model,
    feature: "draft_reply",
    team_id: teamId,
    user_id: userId,
    status: "success",
    attempt,
    input_tokens: inputTokens,
    cached_input_tokens: cachedInputTokens,
    cache_write_tokens: cacheWriteTokens,
    output_tokens: outputTokens,
    reasoning_tokens: reasoningTokens,
    total_tokens: response.usage?.total_tokens ?? inputTokens + outputTokens,
    estimated_cost_usd: estimatedCostUsd,
    latency_ms: Date.now() - startedAt,
    service_tier: response.service_tier ?? "not_reported",
    pricing_version: process.env.OPENAI_PRICING_VERSION,
  });

  return response.output_text;
}
Only an OpenAI request failure emits llm_request_failed. If a Telemetry
delivery fails, report it through your own diagnostic channel without changing
the successful AI result or replacing the original OpenAI error.
Do not log raw prompts, completions, tool arguments, credentials, or private customer content by default. Prefer safe categories such as feature, workflow, input_category, output_category, and error_type.
OpenAI's current prompt-caching guide documents cached_tokens under
usage.input_tokens_details for Responses API results and documents
cache_write_tokens for model families that report cache writes. It also shows
reasoning_tokens under output-token details. See the official prompt caching
requirements.
Reasoning tokens are detail within the response's output-token accounting; do
not add them to output_tokens a second time when estimating a token total.
Keep the separate field because it can explain a change in cost, latency, or
behavior.
4. Include retries in the cost
An application-level retry is a new billable request even when the user sees
one product action. Carry a stable operation_id across attempts and increment
attempt. Log the terminal application outcome separately.
await telemetry.log("ai_operation_completed", {
  operation_id: operationId,
  response_id: response.id,
  team_id: teamId,
  feature: "draft_reply",
  attempts: attempt,
  outcome: "accepted",
  accepted: true,
});
This supports cost per logical operation, cost per accepted output, and retry
amplification. Do not deduplicate request-cost events merely because they share
an operation_id; every provider request can contribute cost.
5. Connect spend to an outcome
Cost per request does not tell you whether the output was useful. Log a separate outcome event when the user accepts, copies, saves, regenerates, or discards the result.
await telemetry.log("ai_output_reviewed", {
  response_id: responseId,
  team_id: teamId,
  user_id: userId,
  feature: "draft_reply",
  outcome: "accepted",
  accepted: true,
});
A stable response_id lets you join usage and outcomes without storing the model output itself.
6. Query daily cost by feature and model
Telemetry automatically adds timestamp_utc, so the application does not need to send its own timestamp field.
SELECT
  date_trunc('day', timestamp_utc) AS day,
  feature,
  model,
  COUNT(*) AS requests,
  SUM(input_tokens) AS input_tokens,
  SUM(cached_input_tokens) AS cached_input_tokens,
  SUM(cache_write_tokens) AS cache_write_tokens,
  SUM(output_tokens) AS output_tokens,
  SUM(reasoning_tokens) AS reasoning_tokens,
  ROUND(SUM(estimated_cost_usd), 4) AS estimated_cost_usd,
  ROUND(AVG(latency_ms), 0) AS avg_latency_ms
FROM llm_request_completed
WHERE timestamp_utc >= now() - INTERVAL '30 days'
GROUP BY day, feature, model
ORDER BY day ASC, estimated_cost_usd DESC;
Visualize estimated_cost_usd as a stacked line or area chart split by feature or model. Pair it with request volume and accepted-output rate so that a cost increase can be interpreted in context.
7. Reconcile estimates to the invoice
Request telemetry answers where spend came from. The provider invoice answers what was billed. Reconcile both at a shared grain such as provider project, model, service tier, currency, and UTC billing day.
SELECT
  date_trunc('day', timestamp_utc) AS day,
  model,
  service_tier,
  pricing_version,
  COUNT(*) AS requests,
  ROUND(SUM(estimated_cost_usd), 4) AS estimated_cost_usd
FROM llm_request_completed
WHERE timestamp_utc >= now() - INTERVAL '30 days'
GROUP BY
  date_trunc('day', timestamp_utc),
  model,
  service_tier,
  pricing_version
ORDER BY day ASC, model ASC, service_tier ASC;
Store the invoice total in a separate finance-controlled dataset, then compare like-for-like periods. Differences can come from price changes, incomplete events, credits, batch or priority processing, non-token tools, images, audio, currency conversion, or a provider project missing from application telemetry. Do not "fix" event history merely to force agreement; record the reconciliation explanation.
What to alert on
Useful alerts include:
- daily estimated spend above an expected budget;
- cost per accepted output above a tested threshold;
- retries or failures increasing for one model or feature;
- cached-input share falling after a prompt or tool-schema change;
- cache writes increasing without a corresponding future cache-read benefit;
- reasoning-token share changing for one prompt version or workflow;
- p95 latency increasing while accepted-output rate stays flat or falls;
- usage events arriving without a recognized
pricing_version.
Next steps
Use the complete LLM cost by feature SQL recipe to inspect an example result and dashboard design. Then add the accepted AI output per dollar recipe to compare product value with estimated spend.
For a complete implementation path, continue to the OpenAI Agents integration, the LLM cost tracker template, and the AI agent telemetry product guide. These pages connect request-level cost data with agent runs, tool calls, dashboards, and retained product outcomes.
For the underlying API shape, see the OpenAI developer quickstart and Responses API reference.