Explore structured events without starting from SQL
Use Explore to inspect rows, group events, or draw a chart from one table. Choose filters and aggregations in the interface, then run the query. You can use the result to check new instrumentation or create a dashboard or alert.
The generated SQL remains visible. Treat the controls as a query builder, not a separate analytics language: inspect the result, review the generated query, and move to the Query workspace when the question needs joins, several common table expressions, or a reusable metric definition.
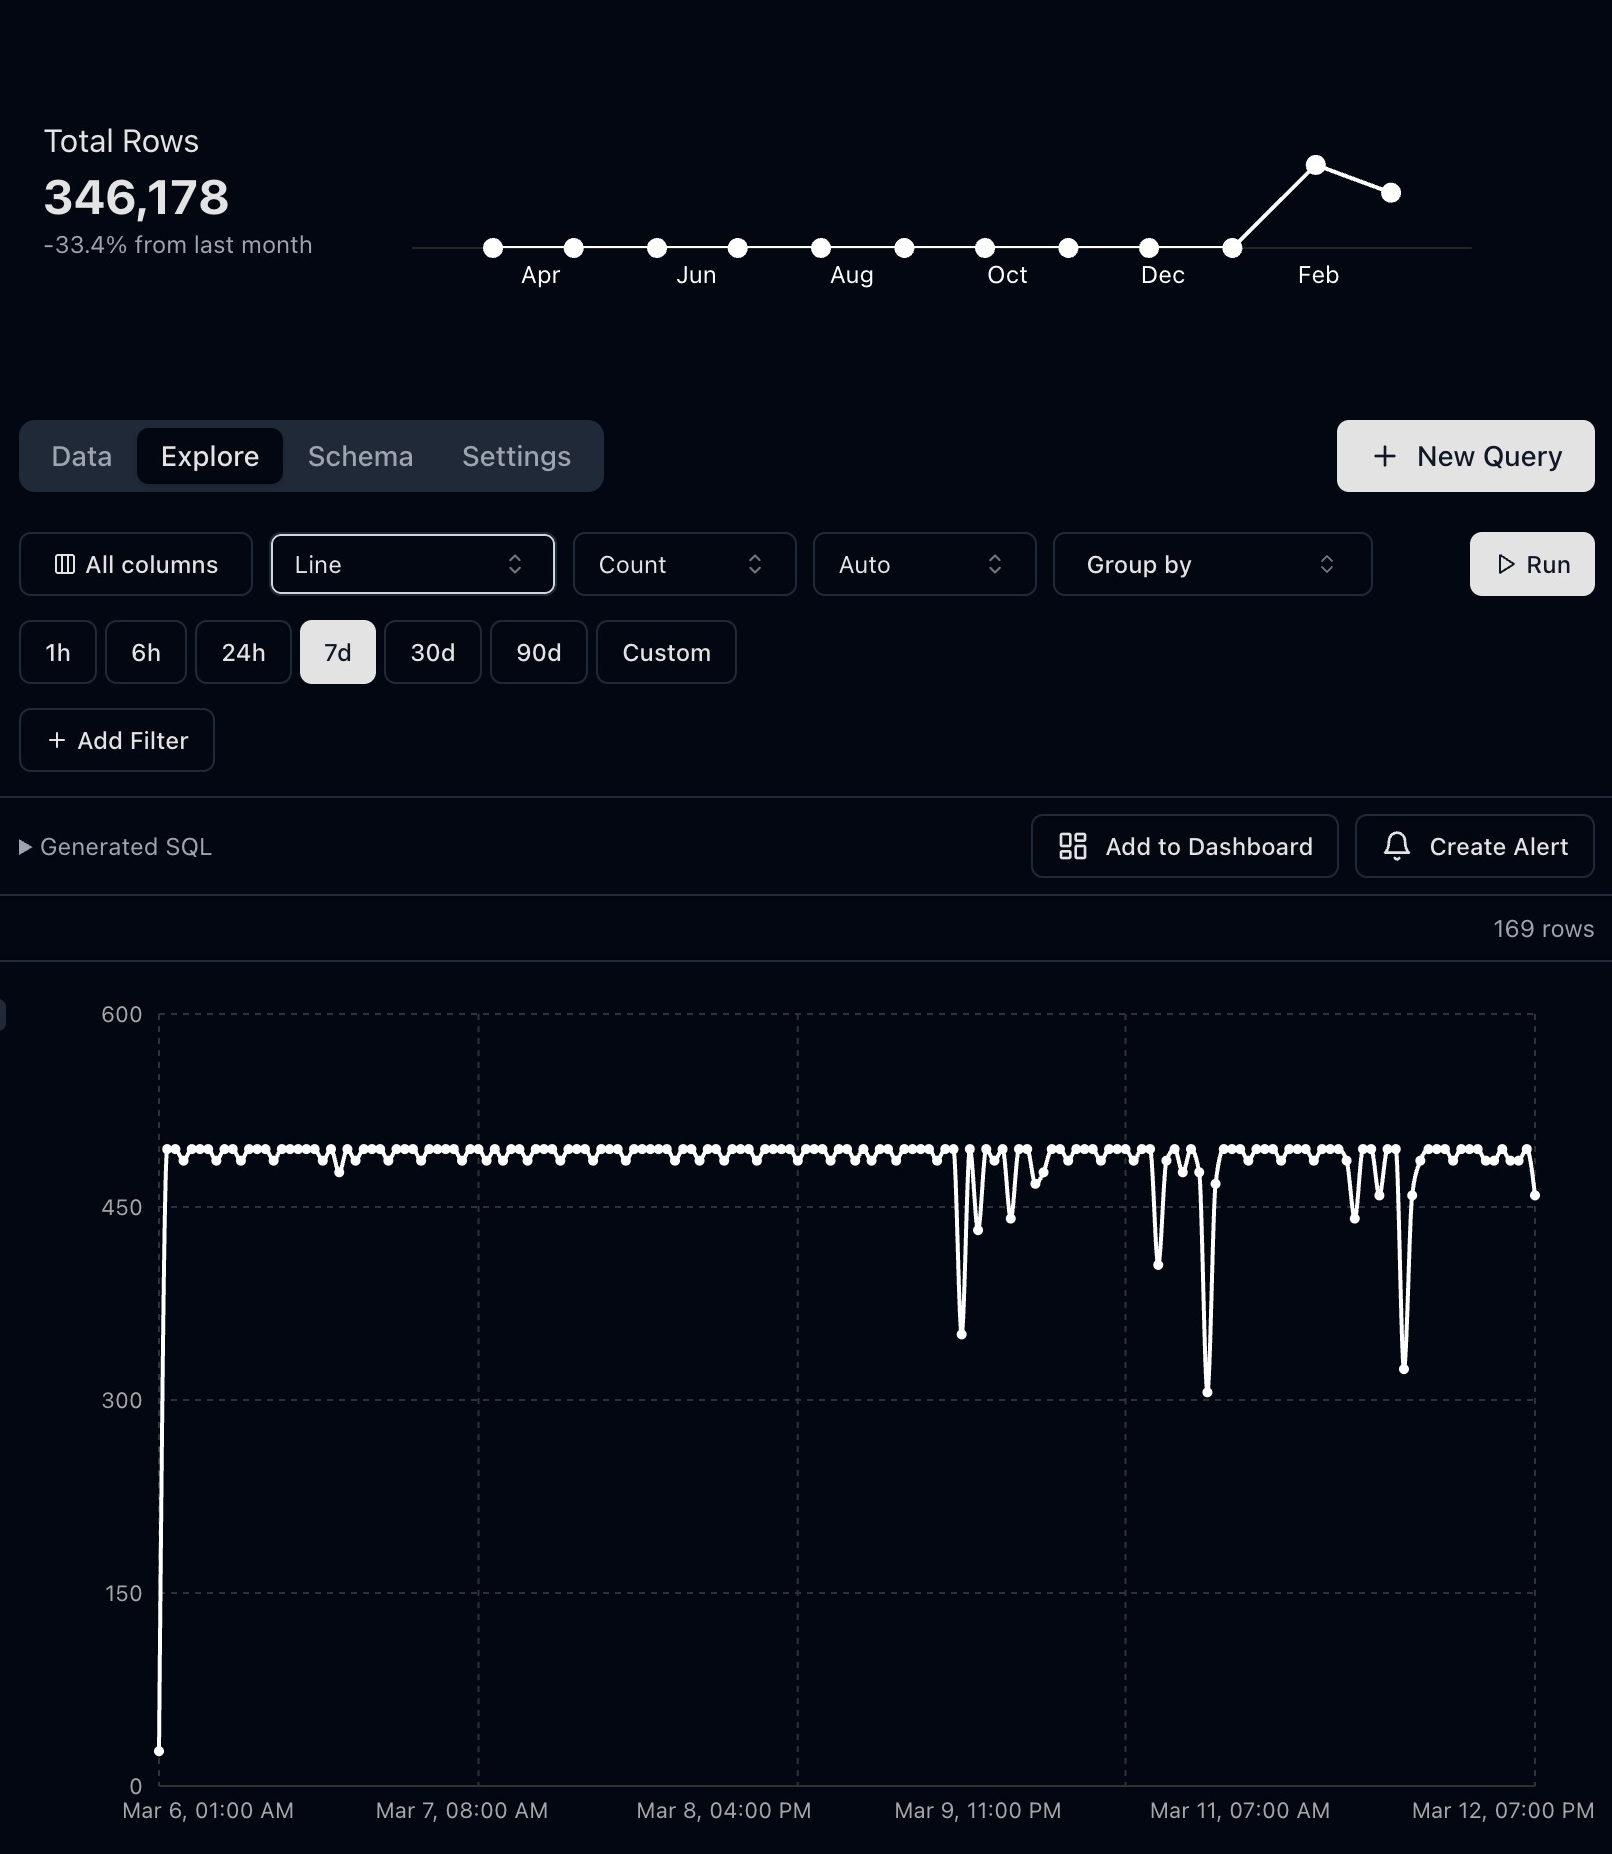
Hourly p95 latency from synthetic API events, with Monitor this result ready to open alert settings.
Use the named dashboard save button or Save this result to save the reviewed result. Create starter dashboard & save handles an empty workspace; Choose dashboard appears when several destinations exist. For an eligible single-series time chart, Monitor result or Monitor this result opens alert settings.
Start with sample events
Choose an event table and inspect recent rows before adding an aggregation. Confirm:
- the table represents one clear unit of work, such as a completed request or agent run;
- timestamps use the intended occurrence time and time zone;
- numeric fields are numeric rather than numeric-looking strings;
- category fields use stable, bounded values;
- route, release, tenant, and correlation fields are populated where expected;
- sensitive values are absent or transformed according to your privacy policy.
A chart can hide nulls, mixed units, duplicate delivery, and unexpectedly sparse fields. Samples expose those issues before they become a misleading rate or percentile.
Build a focused result
Explore supports samples and table results plus line, bar, and stacked-area charts. Choose the smallest view that answers the question.
- Select the table and time range.
- Add filters for stable fields such as
environment,service,outcome, or a route template. - Choose
count,sum,average,min,max, or a percentile aggregation. - Select the numeric field when the aggregation requires one.
- Split the series only by a bounded dimension that helps explain the result.
- Inspect the generated SQL and the returned row count.
Nested structured fields can be filtered when they are present in the table schema. Prefer explicit columns and route templates over raw URLs or arbitrary object contents.
Example questions
| Question | Suggested controls |
|---|---|
| Did API failures increase after a release? | Count events by time, filter to failed outcomes, split by release |
| Which job queue is retrying most often? | Count events, filter to attempts greater than one, split by queue |
| Is model cost rising for one feature? | Sum estimated cost by time, split by bounded feature name |
| Did browser performance change? | Select a percentile of a Web Vital, filter by metric, split by release |
Keep volume next to rates and percentiles. A severe-looking change based on three events should not be interpreted like the same change based on three million.
Review the generated SQL
Before saving the result, check that the generated query:
- filters the intended time field and environment;
- uses the correct denominator for a rate;
- handles nulls deliberately;
- groups at the same grain as the decision;
- does not split by a high-cardinality identifier;
- excludes an incomplete newest time bucket when that would distort the comparison.
Open the result in Query when you need to deduplicate deliveries, join tables, pre-aggregate before a join, compare several cohorts, or document a metric in SQL. Explore is intentionally centered on one-table investigation.
Promote a result
Use the named dashboard save button or Save this result to save a reviewed Explore result when teammates need the same answer repeatedly. Give the widget a decision-oriented name, retain the relevant time range and filters, and place a volume view near any percentage or percentile.
Use Monitor result or Monitor this result to configure an alert only after checking several representative windows. Define the owner, threshold, evaluation window, and response action. A threshold built from sparse or incomplete newest data will create noise.
Verification checklist
- Send a synthetic event with known field values.
- Find that exact event in the sample view.
- Add a filter that includes it, then a filter that excludes it.
- Compare a count or sum with a manually known fixture.
- Review the generated SQL.
- Save the result and reopen it from the target dashboard or alert flow.
- Confirm that another intended team member can interpret the title, filters, units, and response action.
Continue with Write Your First Telemetry SQL Query, Creating Dashboards, or Alerts.