Monitoring website uptime
A heartbeat records both successful and failed checks. That makes an outage visible, but also reveals when the monitoring job itself stops sending data.
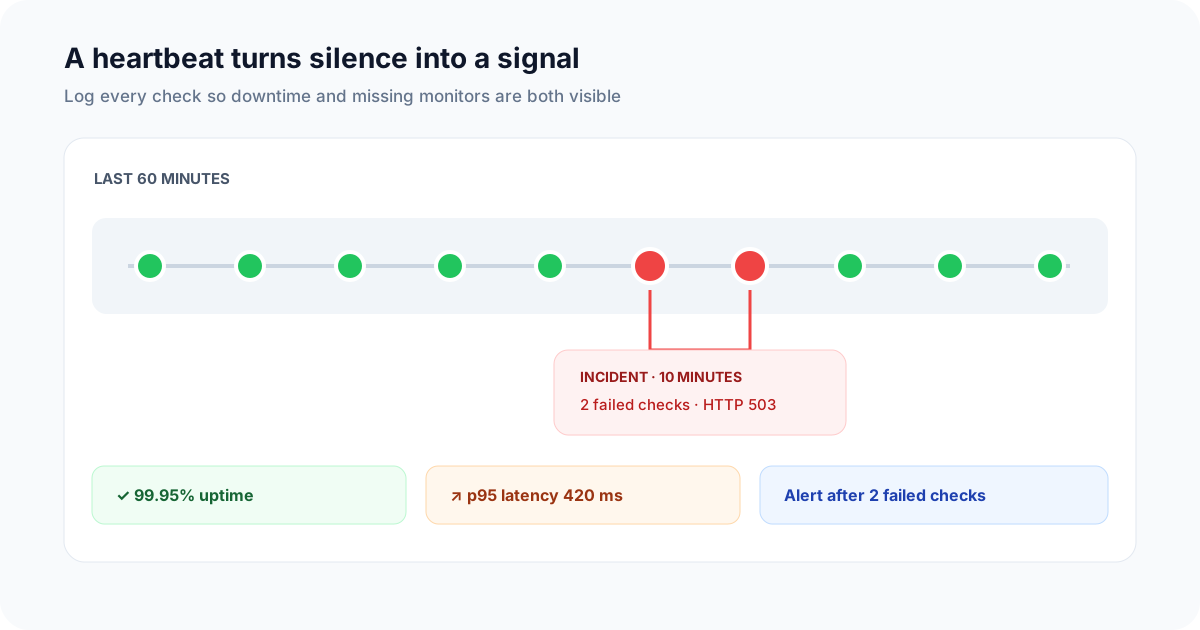
Query regular checks to detect failed requests and gaps in reporting.
Use the Telemetry SDK to send a heartbeat for each website check from Node.js 18 or newer, then query failed checks and gaps in delivery.
Prerequisites
- A valid API key for Telemetry
- Basic understanding of JavaScript and Node.js
1. Install the Telemetry SDK
First, you need to install the Telemetry SDK in your project. If you haven't done so already, run the following command:
npm install telemetry-sh axios
2. Initialize Telemetry
Use Node.js 18 or newer. Set TELEMETRY_API_KEY in server-side environment configuration before running the script; never put the key in browser code.
import telemetry from "telemetry-sh";
import axios from "axios";

const apiKey = process.env.TELEMETRY_API_KEY;
if (!apiKey) throw new Error("Set TELEMETRY_API_KEY in server-side configuration");
telemetry.init(apiKey);
3. Create a heartbeat check
To monitor uptime, you can set up a heartbeat function that will periodically send a ping to the Telemetry service. The heartbeat will log the status of your website, allowing you to monitor its availability.
Here's a basic example of a heartbeat function:
const sendHeartbeat = async (url) => {
  const startedAt = performance.now();
  let heartbeat;

  try {
    const response = await axios.get(url, {
      timeout: 10_000,
      validateStatus: () => true,
    });
    const isOnline = response.status >= 200 && response.status < 400;
    heartbeat = {
      url,
      timestamp: new Date().toISOString(),
      status_code: response.status,
      status: isOnline ? "check_passed" : "http_error",
      is_online: isOnline,
      latency_ms: performance.now() - startedAt,
    };
  } catch {
    heartbeat = {
      url,
      timestamp: new Date().toISOString(),
      status_code: 0,
      status: "probe_error",
      is_online: false,
      error_type: "request_failed",
      latency_ms: performance.now() - startedAt,
    };
  }

  try {
    await telemetry.log("website_uptime", heartbeat);
  } catch {
    try { console.warn("Heartbeat export failed"); } catch {}
  }
  return heartbeat;
};
This is a basic check from one host, not a production availability guarantee. Use only public URLs without credentials or tokens. HTTP 2xx/3xx passes this example’s check; a timeout or transport failure is a failed probe, not proof that the site is down for everyone. The ten-second Axios timeout is not a hard total deadline.
Event export is awaited separately and its failure does not change the HTTP result. The SDK has no configurable delivery timeout here: a stalled export can delay later checks. For production, isolate export in an application-owned bounded queue or HTTP client and monitor the monitor itself.
4. Schedule heartbeats
Start a check immediately, then schedule the next run after the current check and export finish:
const urlToMonitor = "https://example.com"; // Replace with a public URL.
const interval = 5 * 60 * 1000;

async function runHeartbeat() {
  try {
    await sendHeartbeat(urlToMonitor);
  } catch {
    try { console.warn("Heartbeat check failed"); } catch {}
  } finally {
    setTimeout(runHeartbeat, interval);
  }
}

void runHeartbeat();
This scheduler starts immediately, waits for one check and export to finish, then waits five minutes before the next run. It avoids overlapping checks but drifts; it is not a fixed five-minute schedule or a durable scheduler.
5. Query uptime
Query the percentage of recorded probes that passed the HTTP check:
const results = await telemetry.query(`
  SELECT
    url,
    COUNT(*) AS total_pings,
    SUM(CASE WHEN is_online THEN 1 ELSE 0 END) AS online_pings,
    (SUM(CASE WHEN is_online THEN 1 ELSE 0 END) * 100.0 / COUNT(*)) AS observed_check_success_percentage
  FROM
    website_uptime
  WHERE
    timestamp_utc >= now() - INTERVAL '30 days'
  GROUP BY
    url
`);

console.log(results);
The query measures the percentage of observed probes that passed. Missing scheduled checks are absent from its denominator, so this is not elapsed-time uptime or an SLA. Use an expected-check registry and an independent monitor to distinguish missing coverage from observed failures.
6. Explore uptime in Telemetry
Telemetry's UI allows you to visualize and explore your uptime data interactively. Visit Telemetry Dashboard and log in with your credentials to create dashboards, charts, and more based on your uptime monitoring data.
Next steps
An uptime percentage cannot detect a monitor that stopped running. Add the missing heartbeat recipe and alert when the latest check is older than the expected schedule plus a small grace period.