1. Event schema
One row in agent_events, with the types used by the query made explicit.
- timestamp_utc
- Timestamp
- event_name
- Utf8
- data.tool_name
- Utf8
- data.status
- Utf8
- data.args.operation
- Utf8
- data.latency_ms
- Float64
Send JSON events from product flows, APIs, jobs, webhooks, and agents. Telemetry creates the table schema and updates it as you add fields, so you can query the events with SQL.
Outcomes
How it works
Log an event when a user action, job, API call, webhook, or agent run finishes. Record what happened and the fields you need to investigate it.
Include stable identifiers, status, duration, environment, feature, and categorized error context. Keep secrets and raw private content out.
Send test events, inspect the inferred schema, and run a query. Check that the fields answer your question before adding more events.
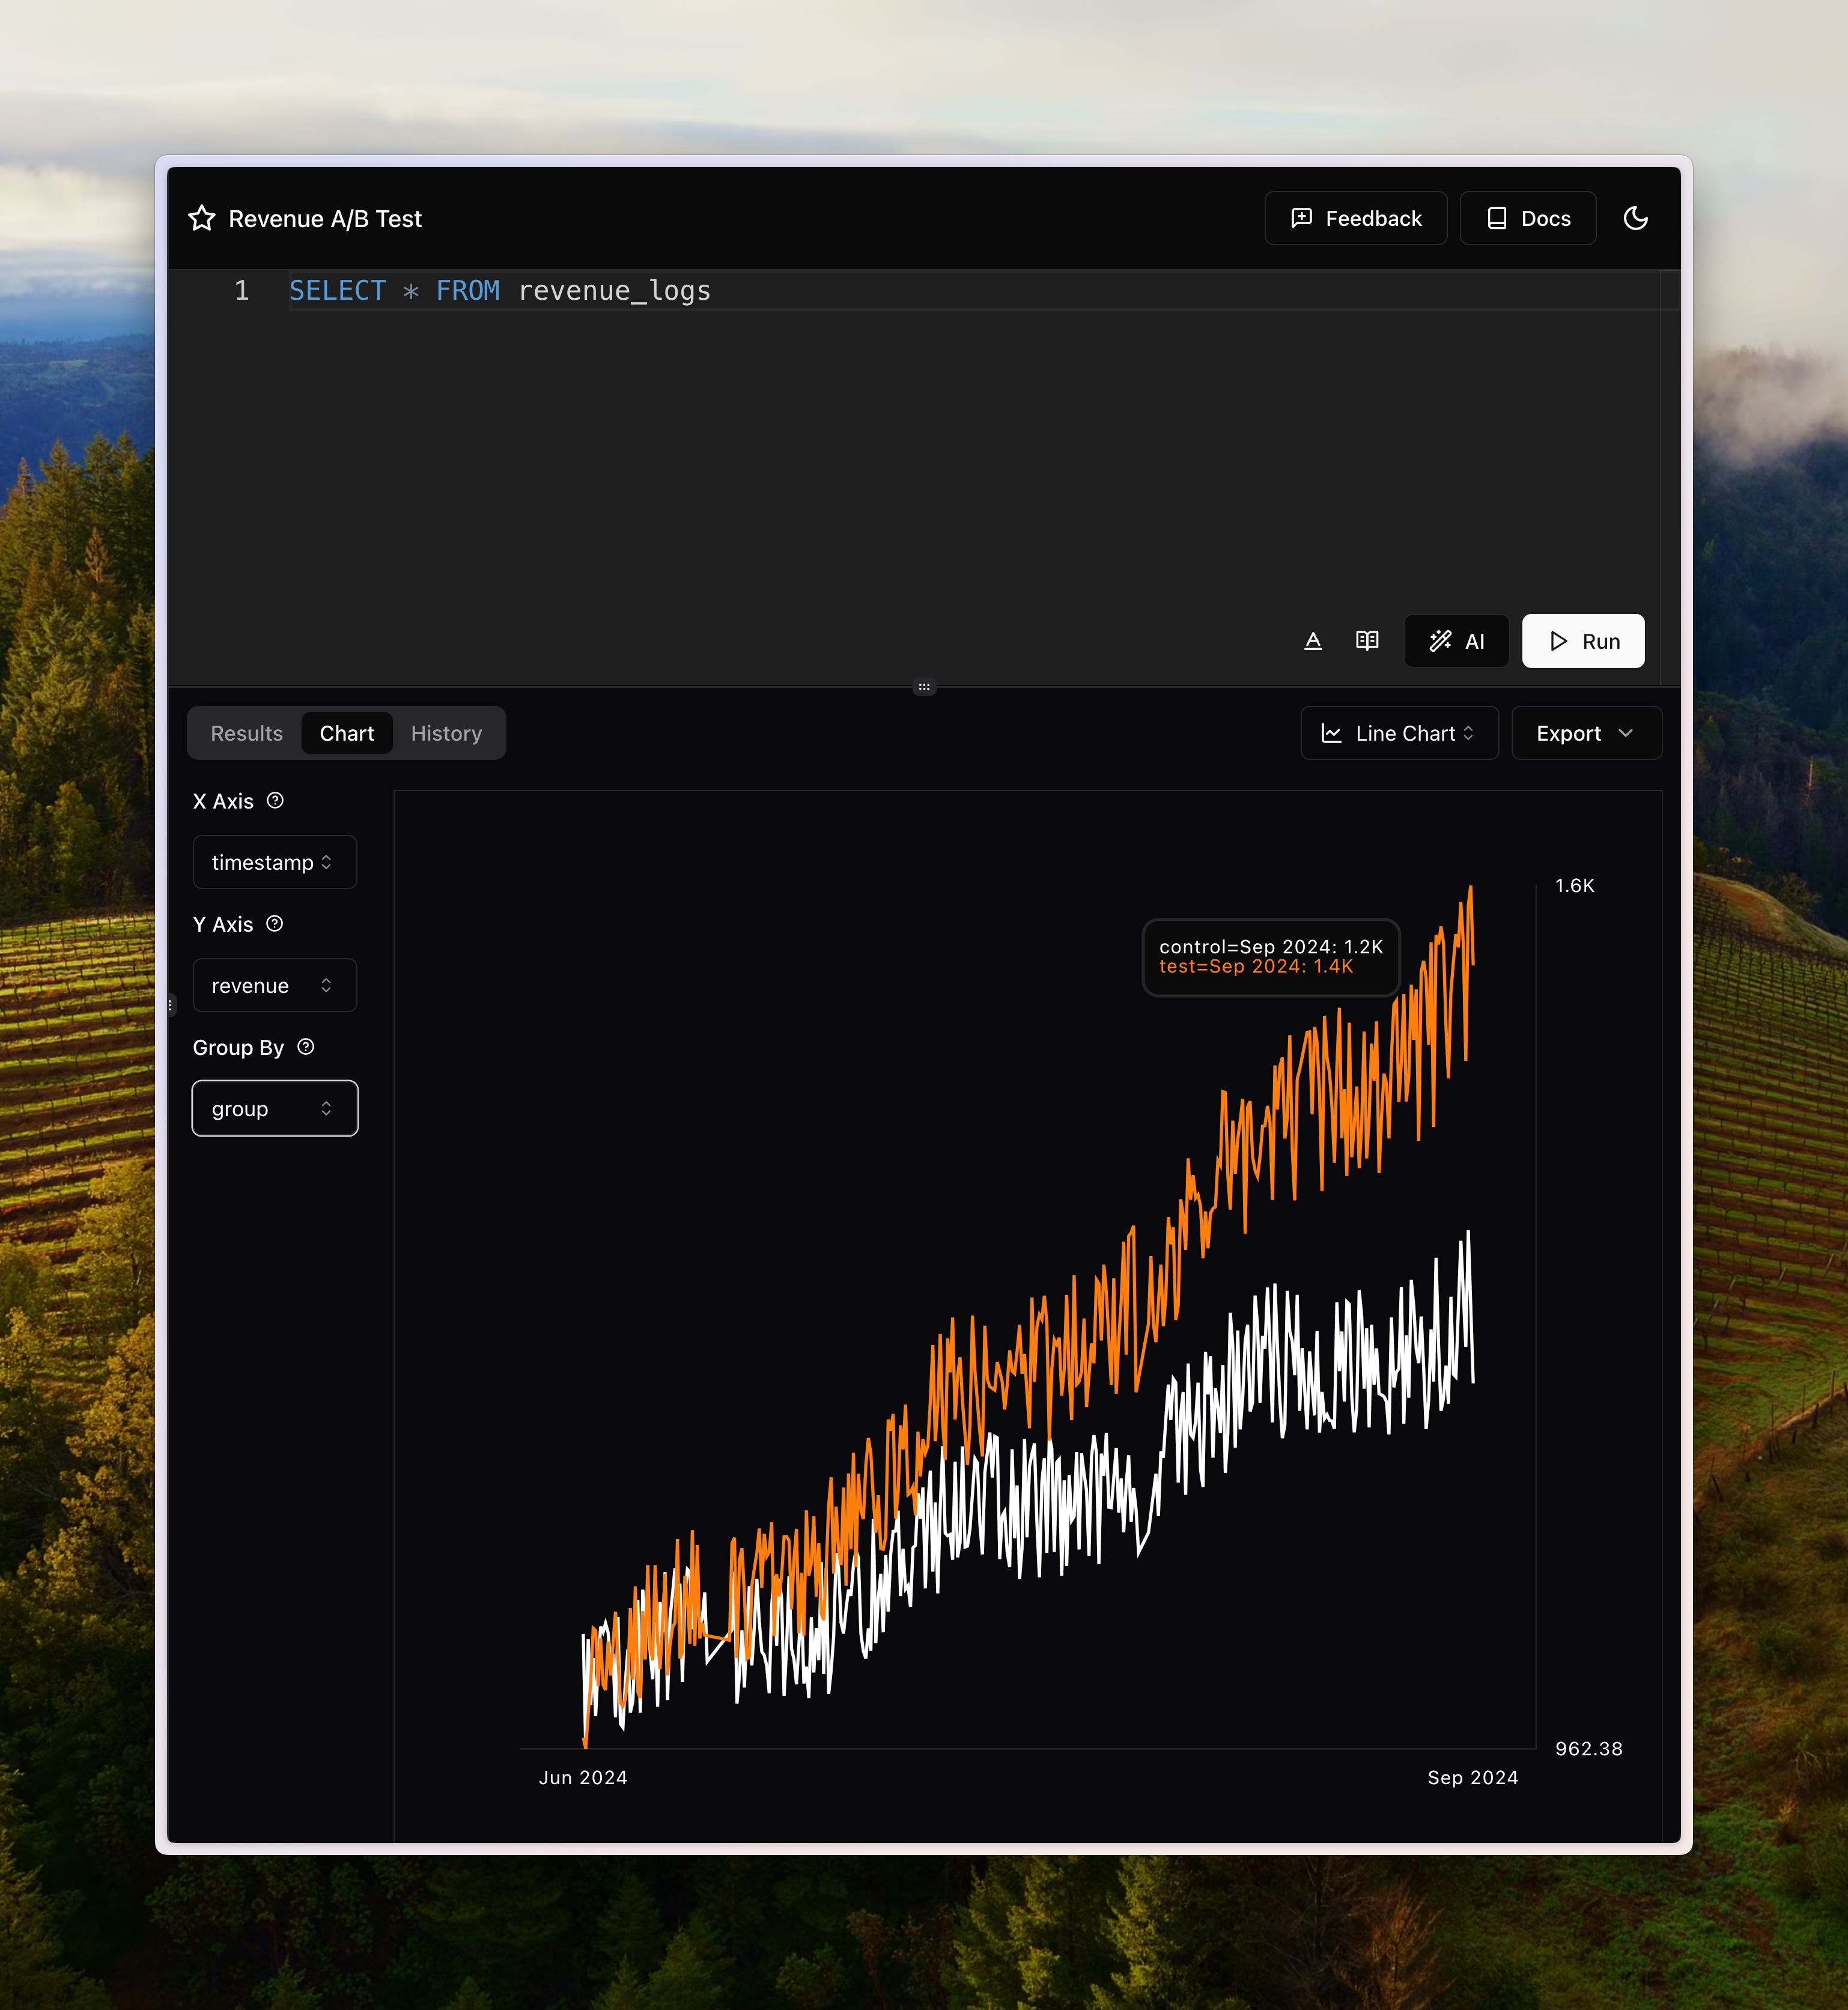
Structured event tables in Telemetry
Event tables and the SQL editor in a Telemetry workspace.
Boundaries
Try the example
This example includes the schema, read-only SQL, and synthetic results. Use it to check how the query works. It does not measure customer results.
One row in agent_events, with the types used by the query made explicit.
Which AI tools and arguments are associated with the most failed calls?
SELECT
  "data.tool_name" AS tool_name,
  "data.args.operation" AS operation,
  COUNT(*) AS calls,
  SUM(CASE
    WHEN "data.status" = 'failed' THEN 1 ELSE 0
  END) AS failures,
  100.0 * SUM(CASE
    WHEN "data.status" = 'failed' THEN 1 ELSE 0
  END) / NULLIF(COUNT(*), 0) AS failure_rate_pct,
  approx_percentile_cont("data.latency_ms", 0.95) AS p95_latency_ms
FROM agent_events
WHERE event_name = 'agent_tool_called'
  AND timestamp_utc >= now() - INTERVAL '7 days'
GROUP BY "data.tool_name", "data.args.operation"
HAVING COUNT(*) >= 20
ORDER BY failure_rate_pct DESC, calls DESC;CRM lookup is both the least reliable tool operation and the slowest at p95.
| tool_name | operation | calls |
|---|---|---|
| crm_lookup | search_contact | 842 |
| order_api | fetch_order | 2210 |
| knowledge_search | semantic_search | 4510 |
Capabilities
See the analysis
Filter dotted nested fields and rank failing tools without flattening the original event payload.
Open recipeFind services, workers, or scheduled tasks that stopped reporting before a failure event appeared.
Open recipeRank API routes by 5xx error rate. Exclude routes with fewer than 20 requests so one failure does not dominate the results.
Open recipeCustomer evidence
"Telemetry is one of the easiest ways to go from dumping in your data to actually understanding it."
Shayan Taslim, LogSnag
Read the customer story"Telemetry makes it super easy to track, analyze, and visualize what's going on in my business. It's the perfect mix of simple and powerful."
Namu Kang, Browserflow
Read the customer storyRelated capabilities
Use a focused prompt, send synthetic events, and verify the first useful query before expanding coverage.