Revenue a/b tests
Revenue totals alone can favor whichever variant received more traffic. Log assignment, exposure, and completed revenue so you can compare revenue per exposed visitor and evaluate uncertainty.
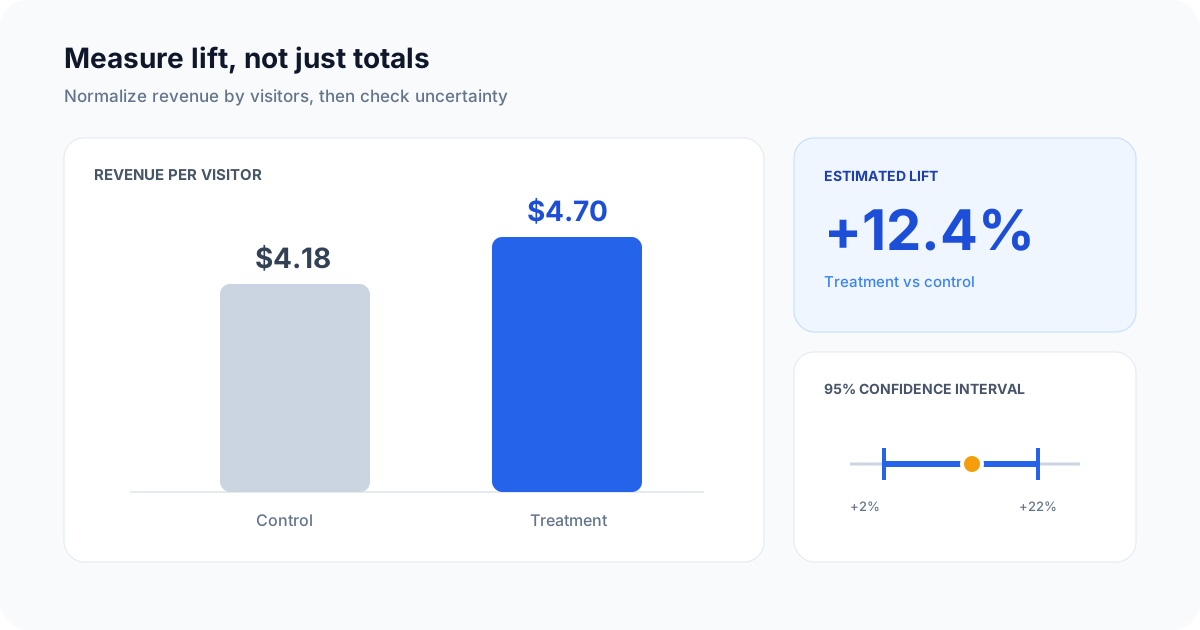
Normalize revenue by exposure before deciding whether a treatment produced meaningful lift.
1. Define the experiment
Before shipping, write down:
- a stable experiment identifier;
- the control and treatment variants;
- the unit of assignment, such as visitor, user, or team;
- the primary metric and guardrail metrics;
- a minimum sample size, test duration, and stopping rule.
One subject must stay in one variant for the life of the experiment.
2. Initialize Telemetry
npm install telemetry-sh
import telemetry from "telemetry-sh";

telemetry.init(process.env.TELEMETRY_API_KEY);
3. Log assignment and exposure
Record exposure only when the subject can actually experience the treatment.
const logExperimentExposure = ({ visitorId, variant }) => {
  telemetry.log("experiment_events", {
    event_name: "experiment_exposed",
    experiment_id: "checkout_copy_v2",
    visitor_id: visitorId,
    variant, // "control" or "treatment"
  });
};
Use an internal identifier instead of an email, cookie value, or other personal data.
4. Log completed revenue
Log completed, non-test purchases to the same table. Preserve the original assignment rather than looking it up from a field that can change later.
const logPurchase = ({ visitorId, variant, orderId, revenueUsd }) => {
  telemetry.log("experiment_events", {
    event_name: "purchase_completed",
    experiment_id: "checkout_copy_v2",
    visitor_id: visitorId,
    variant,
    order_id: orderId,
    revenue_usd: revenueUsd,
  });
};
Decide in advance how refunds, chargebacks, subscriptions, currencies, and repeated orders affect the metric.
5. Compare experiment results
Revenue per exposed visitor keeps unequal traffic from deciding the result. This query creates one row per visitor before aggregating each variant:
WITH per_visitor AS (
  SELECT
    visitor_id,
    variant,
    MAX(CASE WHEN event_name = 'experiment_exposed' THEN 1 ELSE 0 END)
      AS was_exposed,
    SUM(CASE WHEN event_name = 'purchase_completed' THEN revenue_usd ELSE 0 END)
      AS visitor_revenue_usd
  FROM experiment_events
  WHERE experiment_id = 'checkout_copy_v2'
    AND timestamp_utc >= now() - INTERVAL '30 days'
  GROUP BY visitor_id, variant
)
SELECT
  variant,
  SUM(CASE WHEN was_exposed = 1 THEN 1 ELSE 0 END) AS exposed_visitors,
  SUM(CASE
    WHEN was_exposed = 1 AND visitor_revenue_usd > 0 THEN 1 ELSE 0
  END) AS buyers,
  ROUND(SUM(visitor_revenue_usd), 2) AS total_revenue_usd,
  ROUND(
    SUM(visitor_revenue_usd) /
    NULLIF(SUM(CASE WHEN was_exposed = 1 THEN 1 ELSE 0 END), 0),
    2
  ) AS revenue_per_exposed_visitor_usd,
  ROUND(
    100.0 * SUM(CASE
      WHEN was_exposed = 1 AND visitor_revenue_usd > 0 THEN 1 ELSE 0
    END) /
    NULLIF(SUM(CASE WHEN was_exposed = 1 THEN 1 ELSE 0 END), 0),
    2
  ) AS purchase_conversion_pct
FROM per_visitor
WHERE was_exposed = 1
GROUP BY variant
ORDER BY variant;
6. Evaluate uncertainty
Do not declare a winner from the point estimate alone. Revenue distributions are usually skewed, so export visitor-level results for an appropriate confidence interval or statistical model. Keep the prespecified decision rule with the analysis.
Before trusting the result, check:
- sample-ratio mismatch;
- visitors assigned to multiple variants;
- duplicate order events;
- test transactions, refunds, and mixed currencies;
- whether both variants had equal time to convert;
- movement in guardrail metrics such as error rate or latency.
Next steps
Save the reviewed query and experiment definition together so the chart cannot drift away from its denominator. Use the signup activation funnel recipe for earlier product milestones and feature adoption before upgrade for a non-experimental expansion view.