Profiling code execution
Timing each stage of a request replaces intuition with evidence. Once durations are structured events, you can compare functions across runs, releases, and input-size categories.
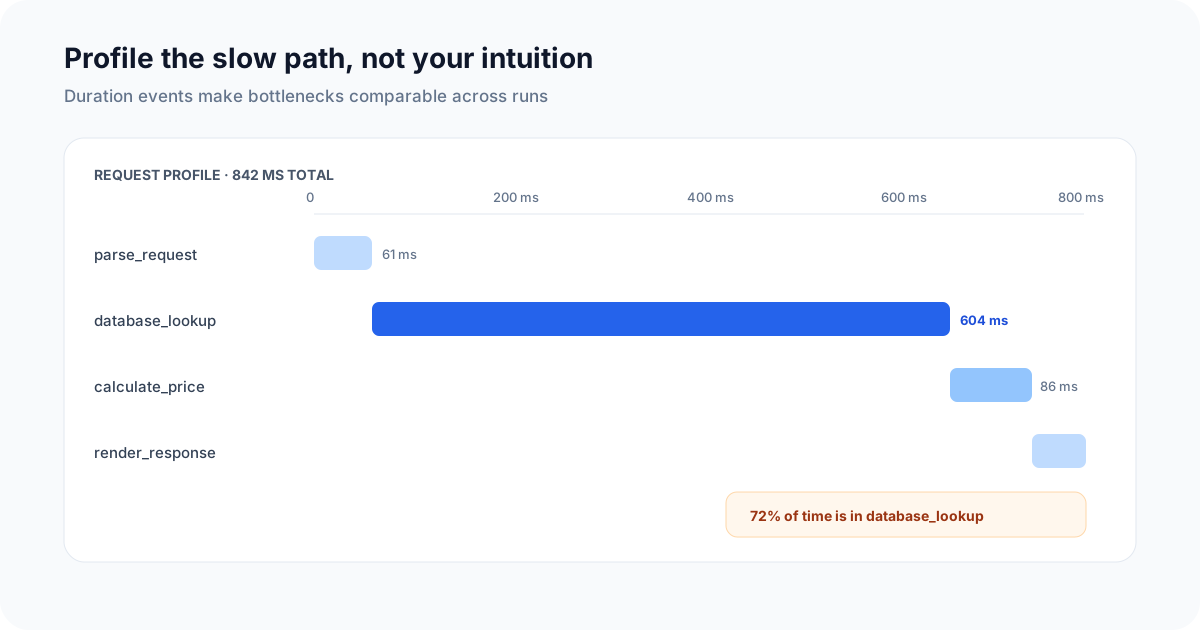
A duration profile tells you which function is worth optimizing first.
Set up the project
npm init -y
npm install telemetry-sh
Instrument each completed step
Use one event per step so the same columns work across workflows. A run_id connects steps that belong to one request or job.
const telemetry = require("telemetry-sh");
const { randomUUID } = require("node:crypto");

telemetry.init(process.env.TELEMETRY_API_KEY);

async function measureStep({ runId, stepName }, operation) {
  const startedAt = Date.now();

  try {
    const result = await operation();
    await telemetry.log("profile_step_completed", {
      run_id: runId,
      step_name: stepName,
      status: "success",
      duration_ms: Date.now() - startedAt,
      release: process.env.APP_RELEASE ?? "unknown",
    });
    return result;
  } catch (error) {
    await telemetry.log("profile_step_completed", {
      run_id: runId,
      step_name: stepName,
      status: "error",
      duration_ms: Date.now() - startedAt,
      error_type: error.constructor?.name ?? "Error",
      release: process.env.APP_RELEASE ?? "unknown",
    });
    throw error;
  }
}

async function profileRequest() {
  const runId = randomUUID();

  const project = await measureStep(
    { runId, stepName: "load_project" },
    () => loadProject()
  );

  return measureStep(
    { runId, stepName: "generate_report" },
    () => generateReport(project)
  );
}
Avoid logging function arguments, database records, or exception messages by default. Safe categories such as input_size_bucket, cache_status, or query_name can explain performance without storing raw content.
Query average and tail duration
SELECT
  step_name,
  COUNT(*) AS runs,
  ROUND(AVG(duration_ms), 0) AS avg_duration_ms,
  ROUND(approx_percentile_cont(duration_ms, 0.95), 0) AS p95_duration_ms,
  ROUND(
    100.0 * SUM(CASE WHEN status = 'error' THEN 1 ELSE 0 END)
      / NULLIF(COUNT(*), 0),
    2
  ) AS error_rate_pct
FROM profile_step_completed
WHERE timestamp_utc >= now() - INTERVAL '7 days'
GROUP BY step_name
ORDER BY p95_duration_ms DESC;
Use p95 rather than only the average so intermittent slow steps remain visible. Split by release after a deployment, and inspect individual run_id values when several slow steps belong to the same request.
Build the performance view
Start with:
- a bar chart of p95 duration by step;
- a line chart of p95 over time for the slowest steps;
- a result table split by release;
- a recent-events table filtered to error or extreme-duration rows.
Profile at a useful boundary. Do not emit an event for every tiny function in a hot loop; that adds overhead and produces a dataset that is difficult to interpret.
Next steps
When the measured workflow is an API request, use the API latency percentiles recipe for a complete result visualization, dashboard layout, and alert design.