Incident response with SQL
Start an incident investigation by finding when the failure began and which users and workflows it affects. Compare releases and recent changes, then check whether the workflow has recovered. With those fields in structured events, you can build the timeline in SQL.
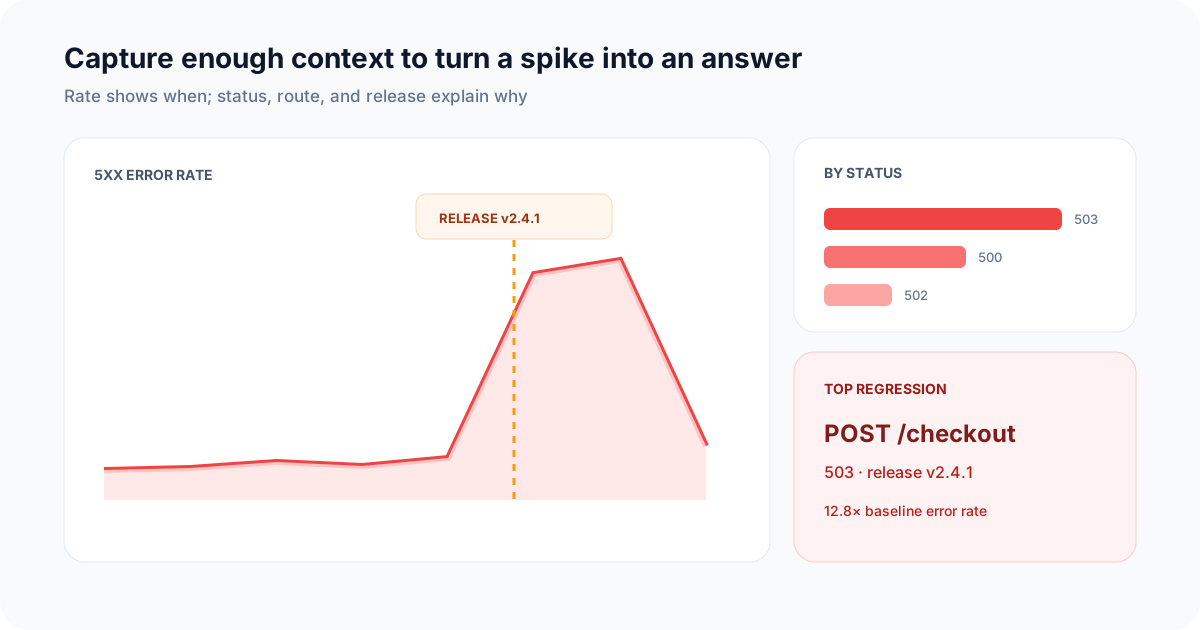
Start broad, then preserve the route and release dimensions that can explain the change.
Start with a bounded signal
Choose a stable completion event such as api_request_completed, then compare complete five-minute buckets. Keep route templates, release identifiers, status, error categories, and safe account identifiers as separate fields.
SELECT
  date_bin(INTERVAL '5 minutes', timestamp_utc, TIMESTAMP '1970-01-01') AS bucket,
  COUNT(*) AS requests,
  100.0 * SUM(CASE WHEN status = 'failed' THEN 1 ELSE 0 END)
    / NULLIF(COUNT(*), 0) AS error_rate_pct
FROM api_request_events
WHERE timestamp_utc >= now() - INTERVAL '2 hours'
GROUP BY bucket
ORDER BY bucket;
Do not declare an incident from one low-volume bucket. Compare the rate with request volume and the operating objective for that service.
Scope affected routes and releases
Once the start time is clear, preserve dimensions that can explain the change. Group by route and release, keep a minimum-volume threshold, and rank by failed requests as well as rate.
SELECT
  route_template,
  release,
  COUNT(*) AS requests,
  SUM(CASE WHEN status = 'failed' THEN 1 ELSE 0 END) AS failed_requests,
  100.0 * SUM(CASE WHEN status = 'failed' THEN 1 ELSE 0 END)
    / NULLIF(COUNT(*), 0) AS error_rate_pct
FROM api_request_events
WHERE timestamp_utc >= now() - INTERVAL '30 minutes'
GROUP BY route_template, release
HAVING COUNT(*) >= 20
ORDER BY failed_requests DESC, error_rate_pct DESC;
Repeat the query with error_type, dependency, region, or a privacy-safe account identifier only when that dimension can change the response. Avoid raw request bodies, authorization headers, emails, and free-form exception text.
Build and preserve the timeline
Record each hypothesis, query, time window, result, and action in the incident log. Save the most useful queries beside the dashboard so a second responder can reproduce the scope. Mark deploys, feature-flag changes, dependency failures, and recovery actions with their exact UTC timestamps.
Use the API error-rate recipe to rank affected routes, the release regression recipe to compare builds, and the error-budget burn recipe to connect the incident with an availability objective. When responders need an explicit customer-impact contract, start with the incident_impact_observed event schema.
Verify recovery
A rollback or configuration change is not recovery by itself. Wait for complete buckets, verify that error rate and latency returned to their expected ranges, and check that traffic volume did not disappear. Continue watching a window long enough to cover delayed retries and background work.
After the incident, turn the validated detection query into a dashboard or alert, document its minimum volume and ownership, and update the event contract if responders lacked a safe field needed to isolate impact. The alert troubleshooting guide explains how to test the resulting notification path without creating noise.