Event schema
Fields the query expects
| Field | Type | Why it exists |
|---|---|---|
| timestamp_utc | Timestamp | When the run completed or failed. |
| job_name | Utf8 | Stable logical job name. |
| status | Utf8 | success or failed. |
| attempt | Int64 | One-based execution attempt. |
| duration_ms | Float64 | Duration of the attempt. |
Copy the query
SELECT
  job_name,
  COUNT(*) AS attempts,
  SUM(CASE WHEN attempt > 1 THEN 1 ELSE 0 END) AS retries,
  SUM(CASE WHEN status = 'failed' THEN 1 ELSE 0 END) AS failures,
  100.0 * SUM(CASE WHEN attempt > 1 THEN 1 ELSE 0 END)
    / NULLIF(COUNT(*), 0) AS retry_rate_pct,
  approx_percentile_cont(duration_ms, 0.95) AS p95_duration_ms
FROM job_runs
WHERE timestamp_utc >= now() - INTERVAL '7 days'
GROUP BY job_name
ORDER BY retry_rate_pct DESC, failures DESC;
This read-only query is planned and executed against an empty typed table with Apache DataFusion 45.2.0. We review the synthetic sample output separately. Check field types, thresholds, and counting rules against your own data. Read the testing methodology.
Query result
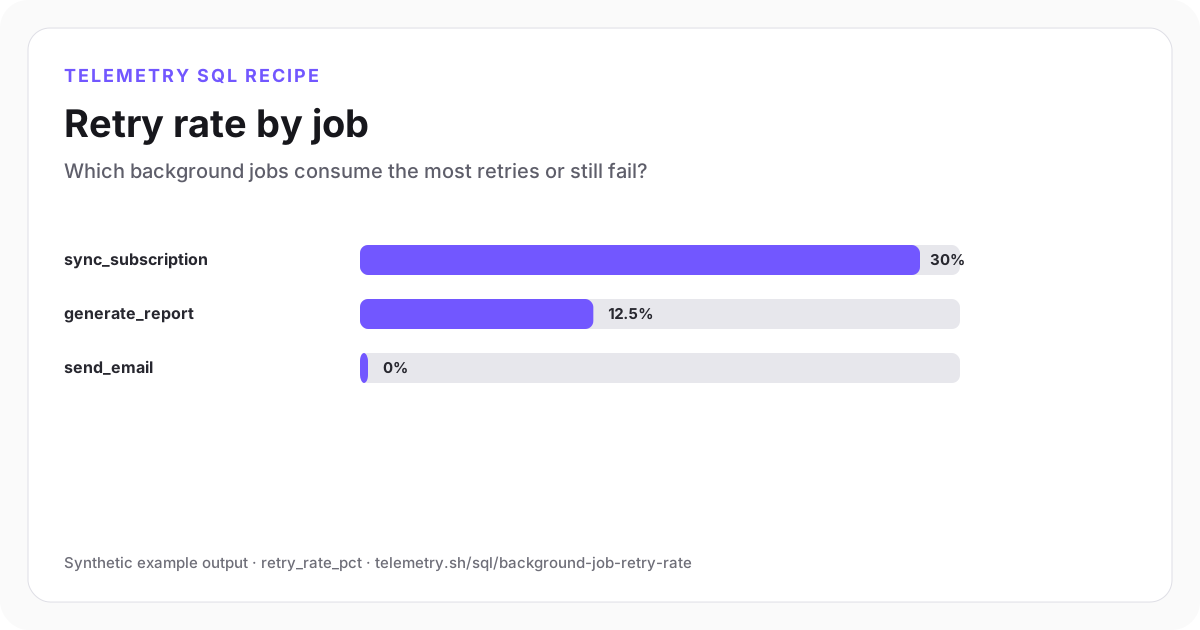
Retry rate by job
Subscription syncs deserve attention even though email has more absolute retry attempts.
| job_name | attempts | retries | failures | retry_rate_pct | p95_duration_ms |
|---|---|---|---|---|---|
| sync_subscription | 10 | 3 | 2 | 30 | 8,000 |
| generate_report | 8 | 1 | 1 | 12.5 | 12,000 |
| send_email | 10 | 0 | 0 | 0 | 900 |
Synthetic example output. Run the query against your own event schema and thresholds before using it for operational decisions.
Reproduce the example
Download the sample data
The JSON bundle includes the event schema with field types, reproducible input rows, exact SQL, expected output, review notes, and engine version. The CSV contains the displayed result.
How the SQL works
- 1Counting attempts instead of logical jobs intentionally exposes the extra execution load caused by retries.
- 2The retry-rate denominator is all attempts. If you prefer a logical-job denominator, include a job_id and count distinct job IDs.
- 3p95 duration helps distinguish quick transient retries from expensive runs that also consume worker capacity.
Edge cases to check
- A scheduled retry may be expected behavior; segment by error_type before changing retry policy.
- Use a stable job_id if several attempts belong to one logical unit of work.
- Dead-letter events should be reported separately because they represent exhausted recovery.
Recommended dashboard
- Bar chart: retry_rate_pct by job_name
- Line chart: failures by day and job_name
- Table: latest final failures with customer and error context
Alert guidance
Alert when retry rate doubles relative to the previous seven-day baseline or a final failure affects a critical workflow.
Read alert setupSet up the events this query needs
Related instrumentation and guides
Continue the analysis
Find stalled background jobs with SQL
Join job start and finish events to identify work that exceeded its expected completion window.
Open recipeMeasure queue wait time by job
Separate time spent waiting in a queue from execution duration and compare p50 and p95 delay by job name.
Open recipeMeasure dead-letter queue growth
Compare dead-letter creation and resolution to find queues accumulating unrecoverable work.
Open recipeRun it on your events
Create a table, adapt the fields, and save the result
Start free, send structured events, and use the query result as a chart, shared dashboard widget, or alert input.