Monitoring website uptime
A heartbeat records both successful and failed checks. That makes an outage visible, but also reveals when the monitoring job itself stops sending data.
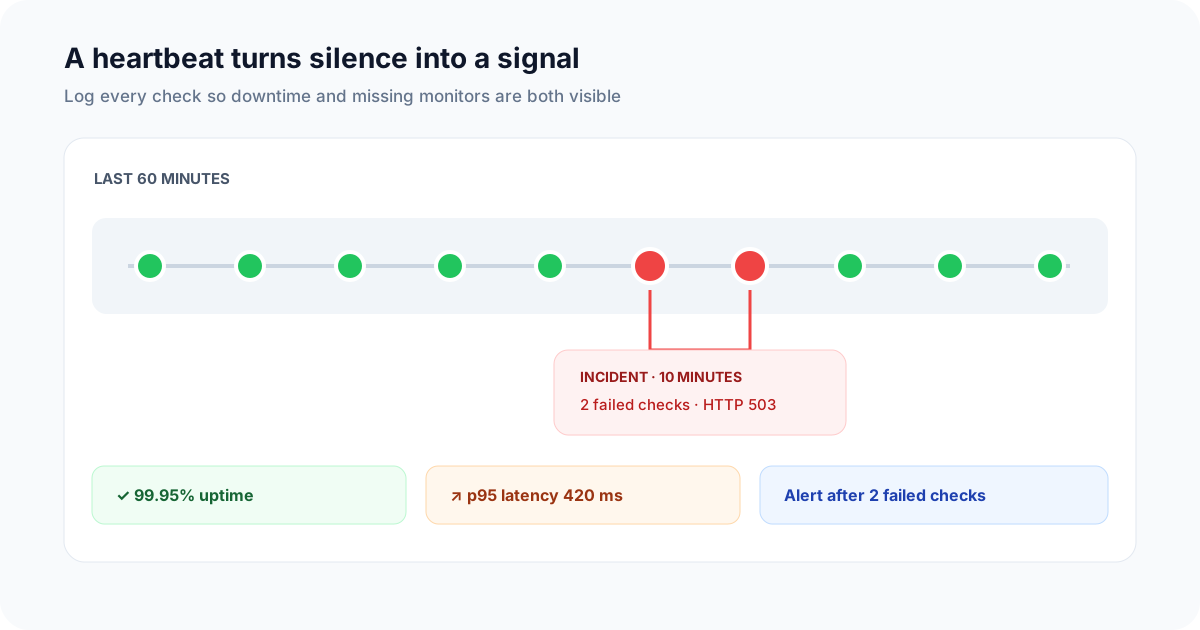
Query regular checks to detect failed requests and gaps in reporting.
Use the Telemetry SDK to send a heartbeat for each website check, then query failed checks and gaps in delivery.
Prerequisites
- A valid API key for Telemetry
- Basic understanding of JavaScript and Node.js
1. Install the Telemetry SDK
First, you need to install the Telemetry SDK in your project. If you haven't done so already, run the following command:
npm install telemetry-sh
2. Initialize Telemetry
After installing the SDK, import and initialize Telemetry in your project. Replace YOUR_API_KEY with your actual Telemetry API key.
import telemetry from "telemetry-sh";

telemetry.init("YOUR_API_KEY");
3. Create a heartbeat check
To monitor uptime, you can set up a heartbeat function that will periodically send a ping to the Telemetry service. The heartbeat will log the status of your website, allowing you to monitor its availability.
Here's a basic example of a heartbeat function:
const sendHeartbeat = async (url) => {
  const startedAt = Date.now();

  try {
    const response = await axios.get(url);

    telemetry.log("website_uptime", {
      url: url,
      status_code: response.status,
      status: "success",
      is_online: true,
      latency_ms: Date.now() - startedAt
    });
  } catch (error) {
    telemetry.log("website_uptime", {
      url: url,
      status_code: error.response ? error.response.status : 0,
      status: "error",
      is_online: false,
      error_type: error.code ?? "request_failed",
      latency_ms: Date.now() - startedAt
    });
  }
};
4. Schedule heartbeats
To continuously monitor uptime, you'll want to send heartbeats at regular intervals. You can achieve this by using setInterval to run the sendHeartbeat function periodically. Here's an example that checks the website every 5 minutes:
const urlToMonitor = "https://example.com"; // Replace with your website URL
const interval = 5 * 60 * 1000; // 5 minutes in milliseconds

setInterval(() => {
  sendHeartbeat(urlToMonitor);
}, interval);
5. Query uptime
Once you've logged enough data, you can query it using Telemetry's query API to analyze your website's uptime. For example, you can calculate the percentage of time your website was online:
const results = await telemetry.query(`
  SELECT
    url,
    COUNT(*) AS total_pings,
    SUM(CASE WHEN is_online THEN 1 ELSE 0 END) AS online_pings,
    (SUM(CASE WHEN is_online THEN 1 ELSE 0 END) * 100.0 / COUNT(*)) AS uptime_percentage
  FROM
    website_uptime
  WHERE
    timestamp_utc >= now() - INTERVAL '30 days'
  GROUP BY
    url
`);

console.log(results);
6. Explore uptime in Telemetry
Telemetry's UI allows you to visualize and explore your uptime data interactively. Visit Telemetry Dashboard and log in with your credentials to create dashboards, charts, and more based on your uptime monitoring data.
Next steps
An uptime percentage cannot detect a monitor that stopped running. Add the missing heartbeat recipe and alert when the latest check is older than the expected schedule plus a small grace period.