1. Event schema
One row in service_heartbeats, with the types used by the query made explicit.
- timestamp_utc
- Timestamp
- service_name
- Utf8
- environment
- Utf8
- status
- Utf8
Create an alert from Explore or SQL results. Telemetry checks complete time-series points on a schedule and emails recipients when the threshold is met.
Outcomes
How it works
Choose a metric someone can act on, such as failed checkouts or API errors. Decide who should receive the alert.
Require enough events for a useful rate. Allow for normal scheduling delays and exclude time buckets that are still receiving events.
Trigger the condition with synthetic data, confirm delivery, and include enough context for the recipient to open the right query or dashboard.
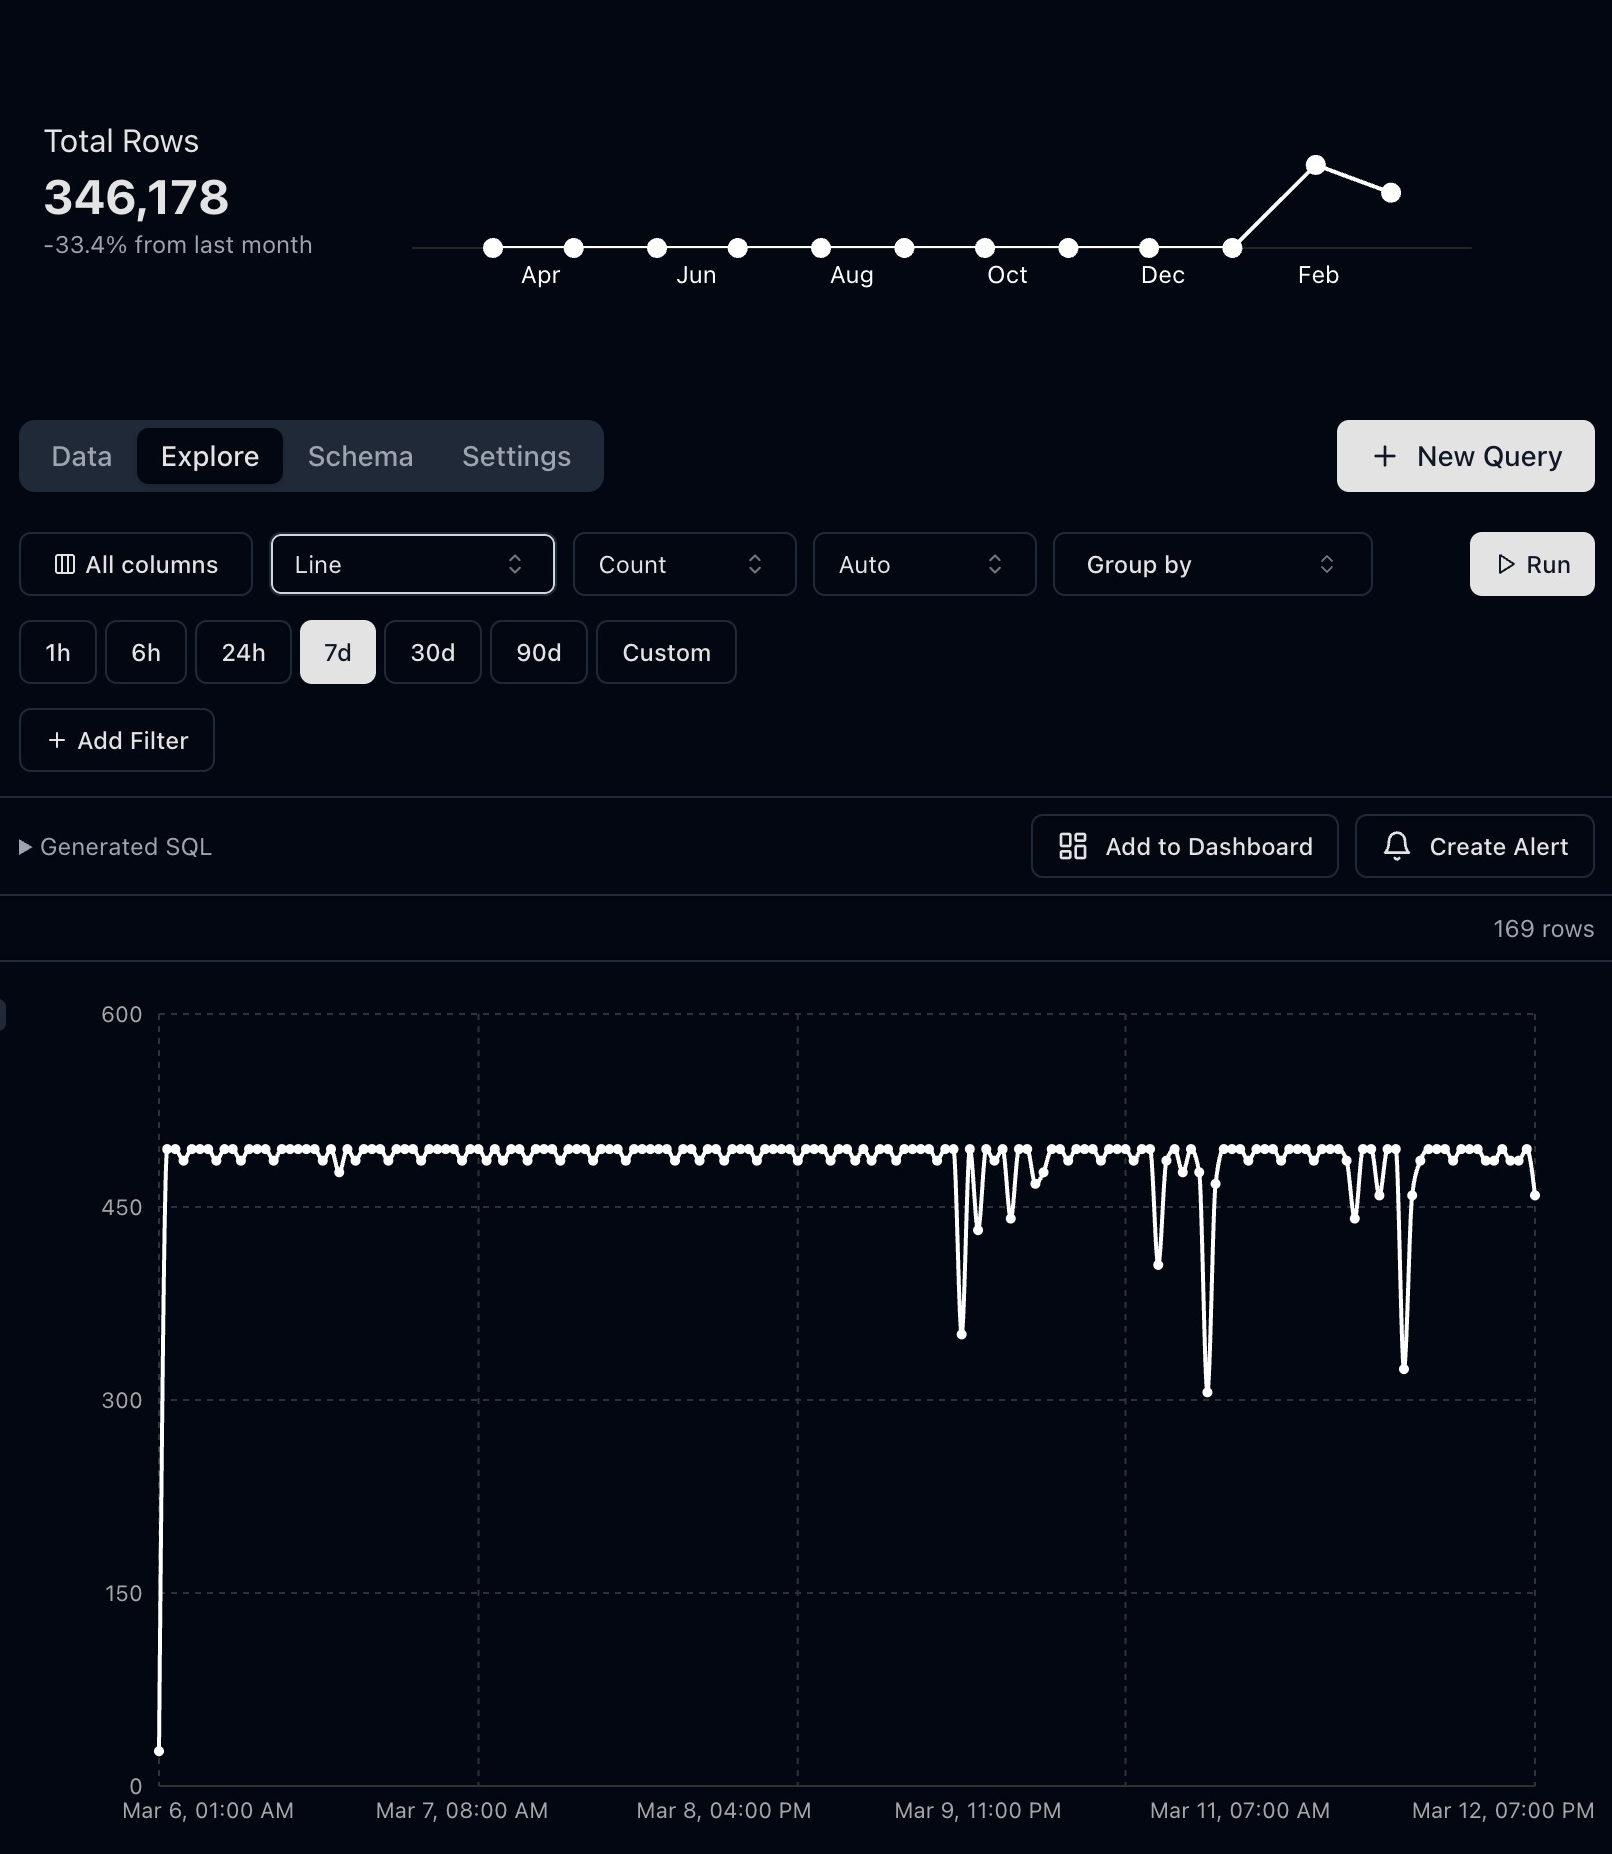
Creating an alert from an Explore result
Hourly p95 API latency in Explore, with the Monitor this result action.
Boundaries
Try the example
This example includes the schema, read-only SQL, and synthetic results. Use it to check how the query works. It does not measure customer results.
One row in service_heartbeats, with the types used by the query made explicit.
Which expected telemetry sources have stopped sending heartbeats?
SELECT
  service_name,
  environment,
  MAX(timestamp_utc) AS last_seen_at,
  COUNT(*) AS heartbeats_in_window
FROM service_heartbeats
WHERE timestamp_utc >= now() - INTERVAL '24 hours'
  AND environment = 'production'
GROUP BY service_name, environment
HAVING MAX(timestamp_utc) < now() - INTERVAL '10 minutes'
ORDER BY last_seen_at ASC;The oldest last_seen_at value should be investigated first.
| service_name | environment | last_seen_at |
|---|---|---|
| billing_sync | production | 2026-07-27 15:04:00Z |
| email_worker | production | 2026-07-27 15:11:00Z |
Capabilities
See the analysis
Find services, workers, or scheduled tasks that stopped reporting before a failure event appeared.
Open recipeJoin job start and finish events to identify work that exceeded its expected completion window.
Open recipeRank API routes by 5xx error rate. Exclude routes with fewer than 20 requests so one failure does not dominate the results.
Open recipeCustomer evidence
Related capabilities
Use a focused prompt, send synthetic events, and verify the first useful query before expanding coverage.