Event schema
Fields the query expects
| Field | Type | Why it exists |
|---|---|---|
| timestamp_utc | Timestamp | When the heartbeat was observed. |
| service_name | Utf8 | Stable source or service name. |
| environment | Utf8 | production, staging, or development. |
| status | Utf8 | healthy or degraded at heartbeat time. |
Copy the query
SELECT
  service_name,
  environment,
  MAX(timestamp_utc) AS last_seen_at,
  COUNT(*) AS heartbeats_in_window
FROM service_heartbeats
WHERE timestamp_utc >= now() - INTERVAL '24 hours'
  AND environment = 'production'
GROUP BY service_name, environment
HAVING MAX(timestamp_utc) < now() - INTERVAL '10 minutes'
ORDER BY last_seen_at ASC;
This read-only query is planned and executed against an empty typed table with Apache DataFusion 45.2.0. We review the synthetic sample output separately. Check field types, thresholds, and counting rules against your own data. Read the testing methodology.
Query result
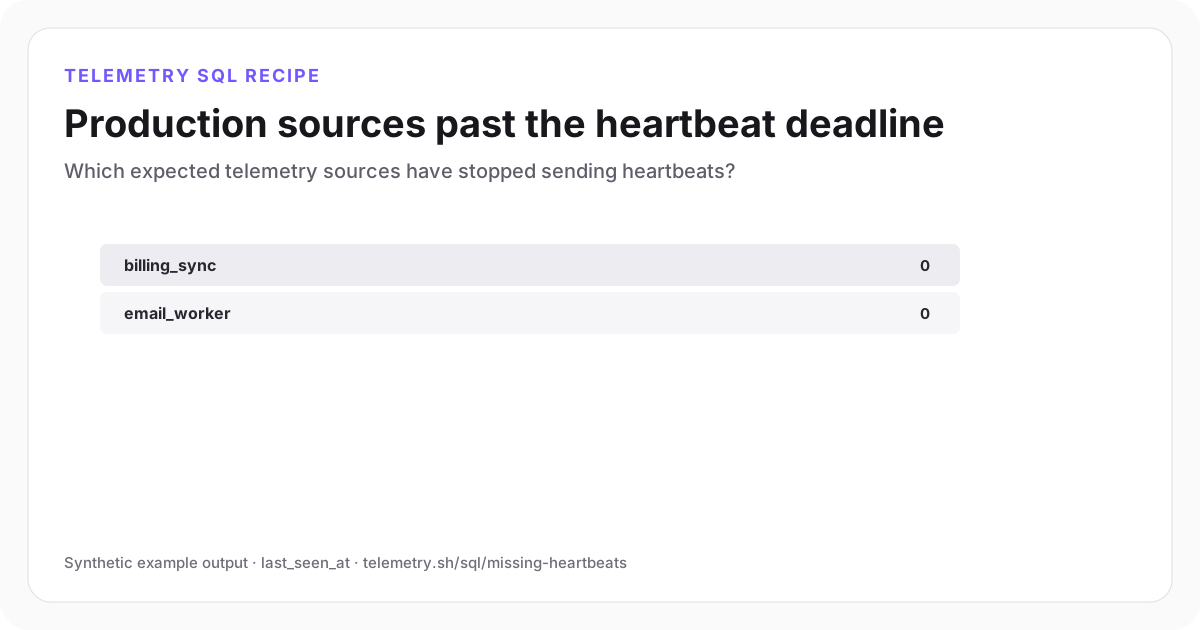
Production sources past the heartbeat deadline
The oldest last_seen_at value should be investigated first.
| service_name | environment | last_seen_at | heartbeats_in_window |
|---|---|---|---|
| billing_sync | production | 2026-07-27 15:04:00Z | 132 |
| email_worker | production | 2026-07-27 15:11:00Z | 139 |
Synthetic example output. Run the query against your own event schema and thresholds before using it for operational decisions.
Reproduce the example
Download the sample data
The JSON bundle includes the event schema with field types, illustrative input rows, exact SQL, expected output, review notes, and engine version. The CSV contains the displayed result.
How the SQL works
- 1MAX(timestamp_utc) returns the newest observed heartbeat for each source.
- 2HAVING filters after grouping, keeping only services whose newest event is older than the allowed silence window.
- 3This query cannot find a source with no events in the lookback window. Keep a table of expected sources to detect those missing sources.
Edge cases to check
- A source that has never emitted a heartbeat cannot appear. Maintain an expected source registry when complete coverage matters.
- Set the threshold above the normal interval plus ingestion and scheduling jitter.
- Separate planned maintenance or disabled workers to avoid noisy alerts.
Recommended dashboard
- Stat: number of sources past deadline
- Table: last_seen_at by service_name
- Line chart: heartbeat volume by source
Alert guidance
Alert after two or three expected intervals are missed, and include the last-seen time and runbook link.
Read alert setupSet up the events this query needs
Related instrumentation and guides
Continue the analysis
Query nested AI tool-call events
Filter dotted nested fields and rank failing tools without flattening the original event payload.
Open recipeDetect error-rate spikes with a rolling baseline
Compare each hourly API error rate with a rolling seven-bucket average instead of relying on one permanent threshold.
Open recipeReconstruct a correlated workflow timeline
Reconstruct ordered cross-service workflow steps and elapsed time from a shared workflow identifier.
Open recipeRun it on your events
Create a table, adapt the fields, and save the result
Start free, send structured events, and use the query result as a chart, shared dashboard widget, or alert input.