Event schema
Fields the query expects
| Field | Type | Why it exists |
|---|---|---|
| timestamp_utc | Timestamp | Request completion time in UTC. |
| status_code | Int64 | HTTP response status code. |
| environment | Utf8 | Deployment environment. |
Copy the query
WITH hourly AS (
  SELECT
    date_trunc('hour', timestamp_utc) AS hour,
    COUNT(*) AS requests,
    SUM(CASE WHEN status_code >= 500 THEN 1 ELSE 0 END) AS bad_requests
  FROM api_requests
  WHERE timestamp_utc >= now() - INTERVAL '24 hours'
    AND environment = 'production'
  GROUP BY date_trunc('hour', timestamp_utc)
)
SELECT
  hour,
  requests,
  bad_requests,
  100.0 * bad_requests / NULLIF(requests, 0) AS error_rate_pct,
  (1.0 * bad_requests / NULLIF(requests, 0)) / 0.001 AS burn_rate
FROM hourly
ORDER BY hour;
This read-only query is planned and executed against an empty typed table with Apache DataFusion 45.2.0. We review the synthetic sample output separately. Check field types, thresholds, and counting rules against your own data. Read the testing methodology.
Query result
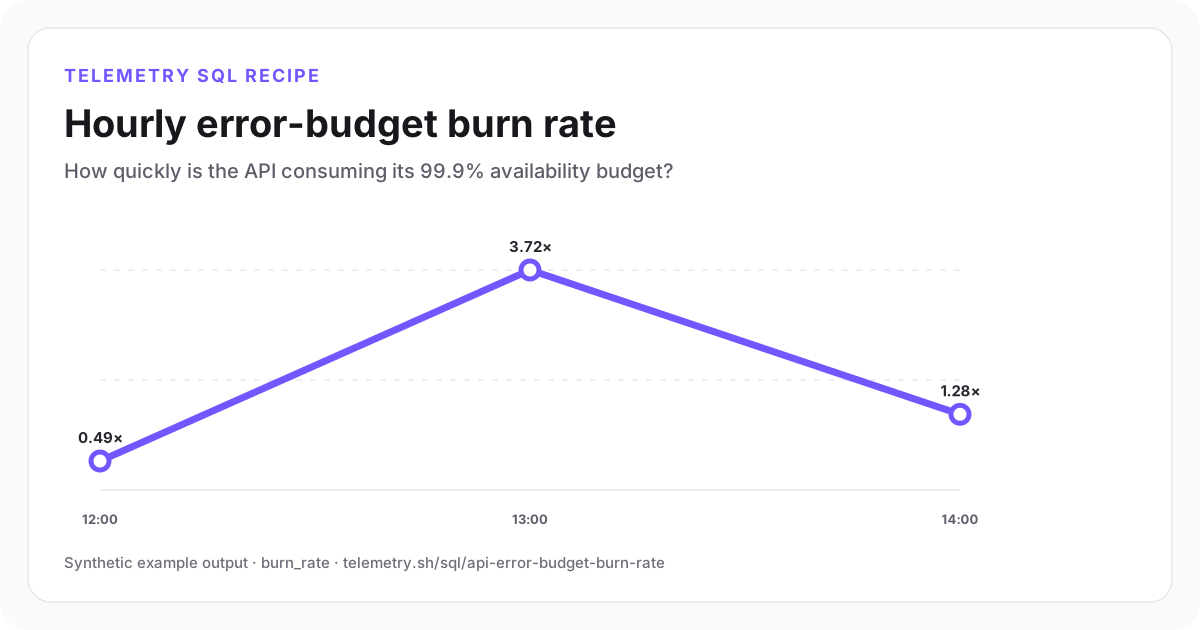
Hourly error-budget burn rate
The 13:00 bucket consumed budget at 3.72 times the sustainable rate.
12:00
0.49×
13:00
3.72×
14:00
1.28×
| hour | requests | bad_requests | error_rate_pct | burn_rate |
|---|---|---|---|---|
| 12:00 | 18,420 | 9 | 0.05 | 0.49 |
| 13:00 | 19,110 | 71 | 0.37 | 3.72 |
| 14:00 | 18,780 | 24 | 0.13 | 1.28 |
Synthetic example output. Run the query against your own event schema and thresholds before using it for operational decisions.
Reproduce the example
Download the sample data
The JSON bundle includes the event schema with field types, illustrative input rows, exact SQL, expected output, review notes, and engine version. The CSV contains the displayed result.
How the SQL works
- 1A 99.9% success objective permits a 0.1%, or 0.001, bad-request ratio.
- 2Divide the observed error ratio by 0.001 to get burn rate. At 1×, errors consume budget at the allowed rate. At 3×, they consume it three times as fast.
- 3The CTE keeps the request denominator visible so tiny buckets can be treated separately.
Edge cases to check
- Define which status codes count as bad for the user-facing SLI; not every 5xx has the same impact.
- Use multi-window alerting for production paging instead of one noisy hourly threshold.
- Exclude synthetic checks or internal traffic only when the SLO definition explicitly excludes them.
Recommended dashboard
- Trend: burn_rate by hour
- Stat: remaining monthly error budget
- Table: routes contributing the most bad requests
Alert guidance
Page only when both a short and long burn-rate window exceed thresholds at meaningful request volume.
Read alert setupSet up the events this query needs
Related instrumentation and guides
Continue the analysis
Calculate API error rate by route
Rank API routes by 5xx error rate. Exclude routes with fewer than 20 requests so one failure does not dominate the results.
Open recipeCalculate p50, p95, and p99 API latency
Compare median and tail latency by endpoint with DataFusion-compatible percentile SQL.
Open recipeCompare API reliability by release
Compare traffic, 5xx rate, and p95 latency across application releases without attributing every post-deploy change to the deploy.
Open recipeRun it on your events
Create a table, adapt the fields, and save the result
Start free, send structured events, and use the query result as a chart, shared dashboard widget, or alert input.