Analyzing webserver errors
An error count shows that something broke. Record the route, status code, release, and request ID to find the failing requests and check whether they started after a deployment.
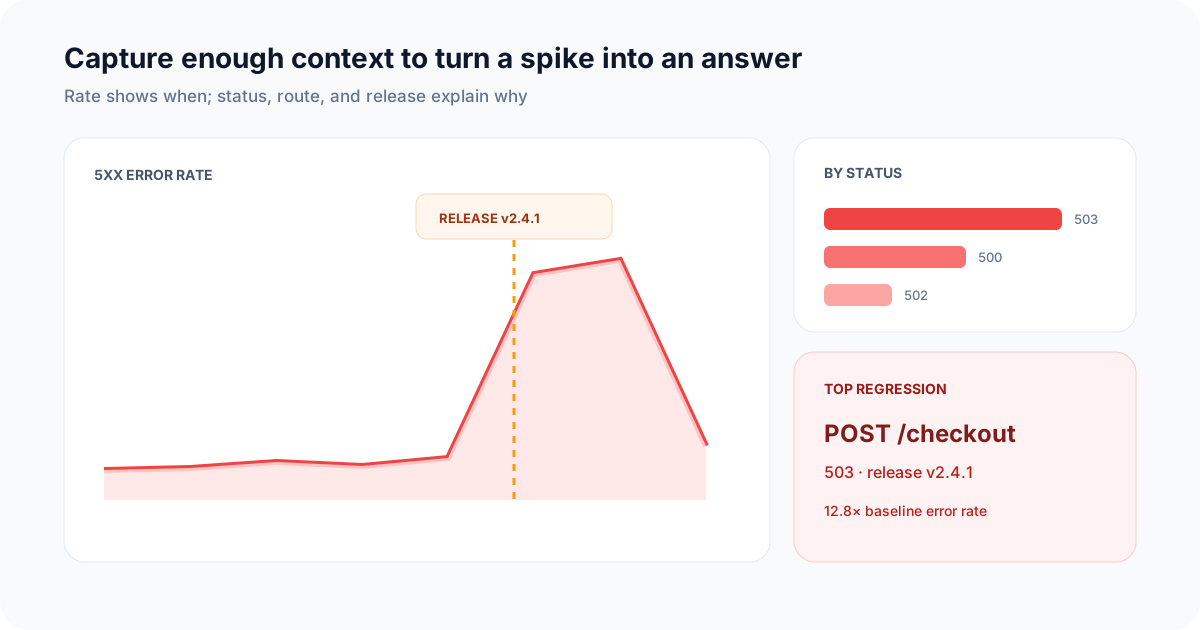
The most useful error event preserves the dimensions you will need during an incident.
This guide adds error logging to an Express.js server with the Telemetry API. For another framework, put the same fields in its error handler and check that failed requests reach Telemetry.
Set up Telemetry
Before we can log any data, we need to set up Telemetry. For this example, we'll use the Telemetry JavaScript SDK.
First, install the Telemetry SDK in your project:
npm install telemetry-sh
Then, initialize the Telemetry client in your application with your API key:
import telemetry from "telemetry-sh";

telemetry.init("YOUR_API_KEY");
Create an Express application
Next, let's set up a basic Express application. If you don't already have Express installed, you can add it to your project with the following command:
npm install express
Now, create a simple Express server:
const express = require('express');
const app = express();
const port = 3000;

app.get('/', (req, res) => {
  res.send('Hello World!');
});

app.listen(port, () => {
  console.log(`Example app listening at http://localhost:${port}`);
});
Add structured error middleware
The error handler belongs after all routes. Capture safe categories and operational context rather than raw bodies, credentials, stack traces, or exception messages that may contain private values.
const express = require("express");
const telemetry = require("telemetry-sh");

telemetry.init(process.env.TELEMETRY_API_KEY);

const app = express();

app.get("/api/projects/:id", async (req, res) => {
  throw Object.assign(new Error("Synthetic failure"), {
    code: "PROJECT_LOOKUP_FAILED",
  });
});

app.use(async (err, req, res, next) => {
  const statusCode = Number(err.statusCode) || 500;

  await telemetry.log("api_request_failed", {
    route_template: req.route?.path ?? "unmatched_route",
    method: req.method,
    status_code: statusCode,
    status: "error",
    error_type: err.constructor?.name ?? "Error",
    error_code: err.code ?? "UNCLASSIFIED_ERROR",
    request_id: req.get("x-request-id") ?? "missing",
    release: process.env.APP_RELEASE ?? "unknown",
  });

  res.status(statusCode).json({ error: "Request failed" });
});

app.listen(3000);
Use route templates such as /api/projects/:id, not raw paths containing customer identifiers. Keep the event schema the same for handled 4xx and 5xx responses when those failures matter to the workflow.
Query and visualize errors
Start with failure rate by route and release, then keep a recent-events table for investigation:
SELECT
  route_template,
  release,
  status_code,
  error_code,
  COUNT(*) AS failures,
  MAX(timestamp_utc) AS last_seen_at
FROM api_request_failed
WHERE timestamp_utc >= now() - INTERVAL '24 hours'
GROUP BY route_template, release, status_code, error_code
ORDER BY failures DESC, last_seen_at DESC;
For a true error rate, log successful and failed requests to the same table with a shared status or status_code field. A failure-only table can rank errors, but it cannot supply the denominator.
Next steps
Use the API error rate by route recipe for a denominator-safe query, example visualization, dashboard layout, and alert guidance. Pair it with API latency percentiles so an incident view covers both correctness and speed.