視覺化分佈
少數大額訂單會把平均值拉高,使其超過大多數客戶的消費金額。按百分位繪製購買金額,查看中位數、分布範圍和最大訂單。
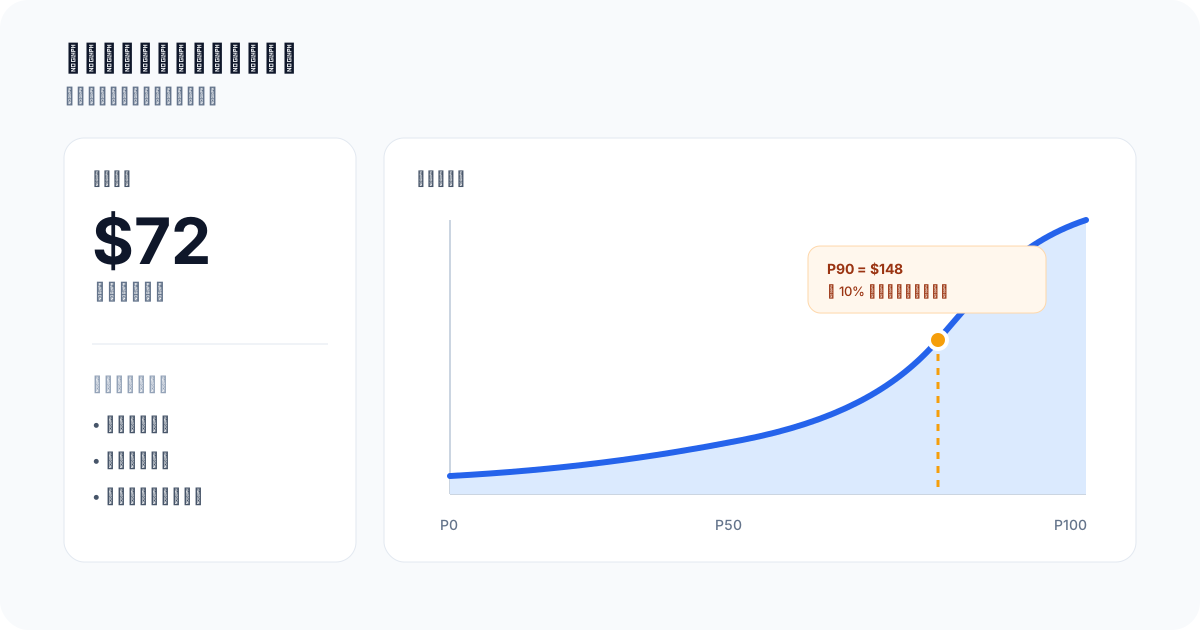
百分位曲線顯示購買量加速的位置以及長尾延伸的程度。
你將建置什麼
您將記錄個人購買金額,查詢每個百分位數的值,並將結果繪製成圖表。與平均值不同,這條曲線回答了以下問題:
- 典型的客戶會花多少錢?檢視 P50(中位數)附近。
- 高價值客戶從哪裡開始?比較 P75、P90 和 P95。
- 長尾有多極端?將 P99 與中位數進行比較。
百分位是一個閾值,而不是收入份額。如果 P90 為 148 美元,則 90% 的購買價格等於或低於 148 美元,10% 的購買價格高於 148 美元。
先決條件
- Telemetry 的有效 API 金鑰
- 對JavaScript和Node.js有基本瞭解
- 電子商務平臺或追蹤客戶購買的任何系統
1.安裝Telemetry SDK
首先,您需要在專案中安裝 Telemetry SDK。如果您還沒有這樣做,請執行以下命令:
npm install telemetry-sh
2、初始化Telemetry
安裝SDK後,在您的專案中匯入並初始化Telemetry。將 YOUR_API_KEY 替換為您實際的 Telemetry API 金鑰。
import telemetry from "telemetry-sh";

telemetry.init("YOUR_API_KEY");
3. 記錄購買金額
為了視覺化客戶購買金額的分佈,您需要記錄每次購買的金額。以下是記錄此資料的範例函式:
const logPurchaseAmount = (customerId, purchaseAmount) => {
  telemetry.log("customer_purchases", {
    customer_id: customerId,        // The ID of the customer
    purchase_amount: purchaseAmount, // The purchase amount in dollars
    currency: "USD",
    status: "completed"
  });
};

// Example usage
logPurchaseAmount("customer_123", 49.99);  // Log a purchase amount for a customer
logPurchaseAmount("customer_456", 120.50); // Log another purchase amount for a different customer
4. 儀器完成採購
您應該將系統設定為在交易完成時自動記錄購買金額。這可以透過將記錄功能整合到您的結帳或支付處理系統中來完成。這是一個簡化的範例:
const processPurchase = (customerId, amount) => {
  // Additional logic for processing the purchase

  // Log the purchase amount
  logPurchaseAmount(customerId, amount);
};

// Example transactions
processPurchase("customer_123", 75.00);    // Log a purchase of $75
processPurchase("customer_789", 300.00);   // Log a purchase of $300
5、查詢分佈
記錄足夠的資料後,您可以使用 Telemetry 的 UI 視覺化購買金額在百分位數上的分佈。
- 建立百分位查詢:
-
在 Telemetry UI 中,導覽到查詢部分。
-
使用以下類似 SQL 的查詢來生成百分位數資料:
WITH purchases AS ( SELECT purchase_amount FROM customer_purchases WHERE timestamp_utc >= now() - INTERVAL '90 days' AND currency = 'USD' AND status = 'completed' ) SELECT 50 AS percentile, approx_percentile_cont(purchase_amount, 0.50) AS purchase_amount FROM purchases UNION ALL SELECT 75, approx_percentile_cont(purchase_amount, 0.75) FROM purchases UNION ALL SELECT 90, approx_percentile_cont(purchase_amount, 0.90) FROM purchases UNION ALL SELECT 95, approx_percentile_cont(purchase_amount, 0.95) FROM purchases UNION ALL SELECT 99, approx_percentile_cont(purchase_amount, 0.99) FROM purchases ORDER BY percentile; -
此查詢會在大多數團隊使用的百分位處生成一條緊湊的曲線。當更平滑的曲線實質上改變決策時,新增更多固定百分位行。
-
- 視覺化資料:
- 在 UI 中,建立一個折線圖,X 軸為
percentile,Y 軸為purchase_amount。 - 這將為您提供一條分佈曲線,顯示不同客戶百分位數的購買金額如何變化,幫助您識別客戶群內的支出模式。
- 在 UI 中,建立一個折線圖,X 軸為
解讀曲線
從P50開始瞭解典型購買情況,然後與P90和P99進行比較。右邊緣附近的急劇上升表明有一個小的高支出部分;曲線越平坦表明支出分佈越均勻。在對結果採取行動之前,過濾退款並測試交易,保持貨幣單位一致,並比較跨段的相同時間視窗。