Creating dashboards
Telemetry dashboards combine charts, tables, and notes in one team view. Pin results from Explore or Query, then arrange widgets and add notes. You can also create dashboards through the API.
What a dashboard includes
- A dashboard is a named page for related metrics.
- Each widget contains a saved chart, table, section header, or note.
- Chart and table widgets use an Explore configuration or a Query result.
- In Edit mode, drag widgets to move them and resize them to fit.
Step 1: create a dashboard
You can create dashboards in three ways:
- In the left sidebar, open Dashboards menu and click New Dashboard.
- From Explore, click Add to Dashboard. If no dashboards exist yet, Telemetry will prompt you to create one first.
- Call
POST /dashboardwith an API key that haswriteorread-and-writescope.
Step 2: add widgets from explore
- Open a table and go to the Explore tab.
- Choose:
- graph type,
Samples,Table,Line,Bar, orStacked Area - aggregation and granularity for chart views
- time range, filters, and group by fields
- graph type,
- Click Run.
- In the results toolbar above the chart, click Add to Dashboard.
- Enter a widget title, select a dashboard, and save.
After you run an Explore query, Telemetry shows the action buttons on the right side of the results toolbar:
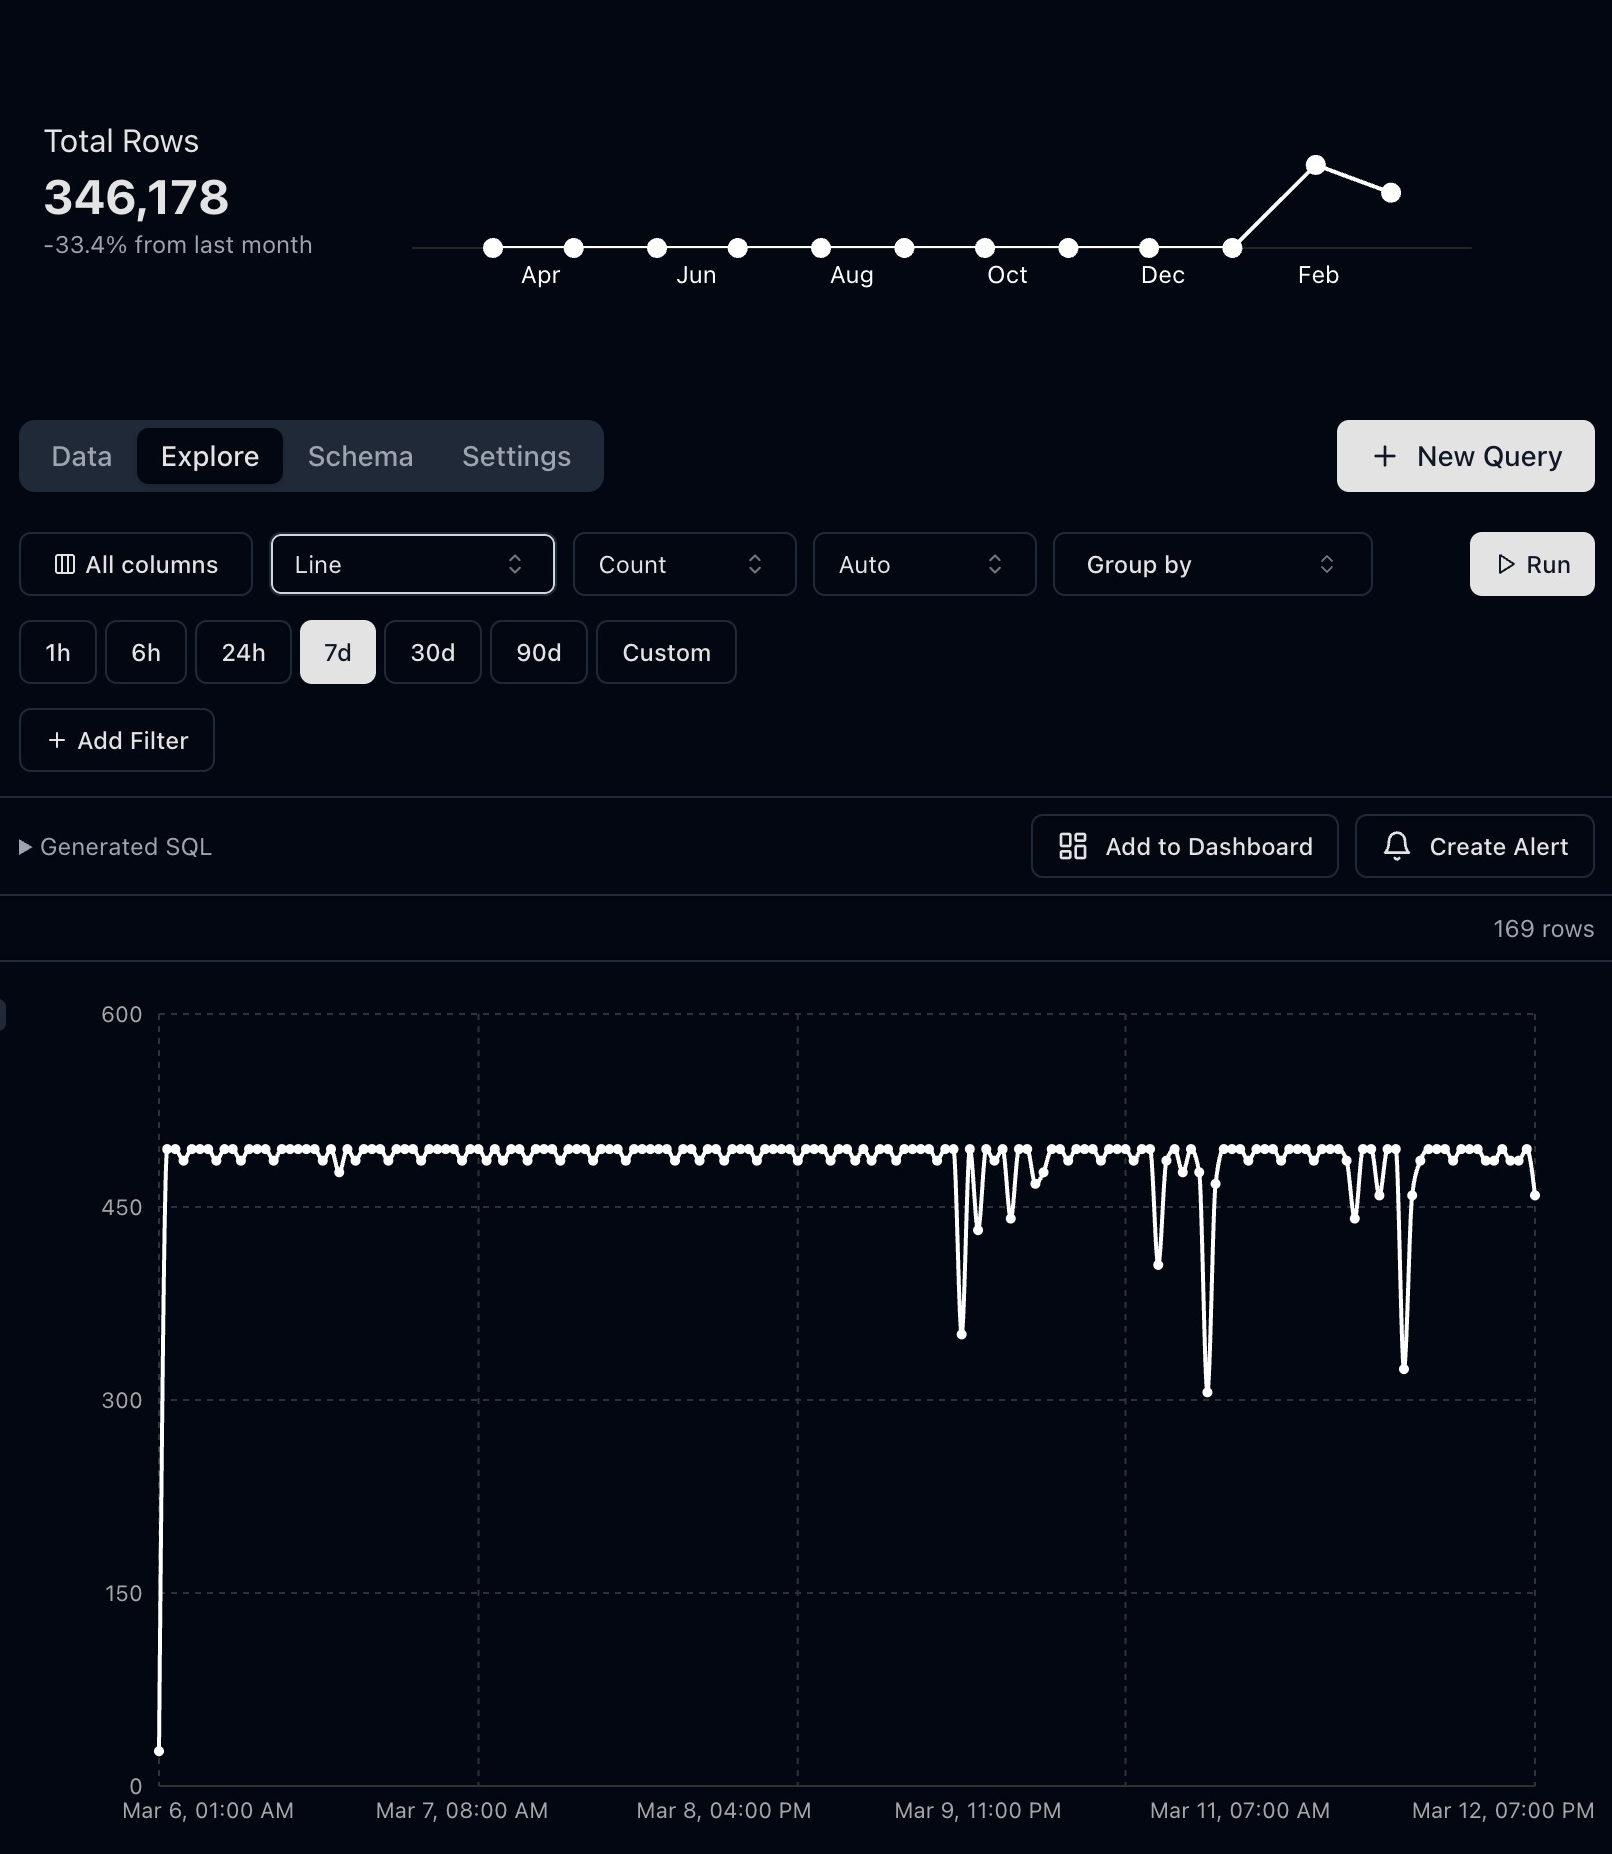
Use Add to Dashboard from the results toolbar after clicking Run.
Telemetry stores the full Explore state, so the widget stays consistent with the chart/table you pinned.
Step 3: add widgets from query
- Open a saved query or draft query.
- Run the query and switch to either Results or Chart.
- Click Add to Dashboard.
- Choose the destination dashboard and save.
Use this path when you want fully custom SQL rather than Explore-generated SQL.
Step 4: arrange and maintain your dashboard
- Open
/team/{team}/dashboard/{dashboard-slug}. - Click Edit.
- Use Add Component to insert:
- Section Header blocks for grouping related widgets under a shared title and description
- Free Text blocks for markdown notes, links, and runbook-style context
- Drag widgets by the handle, resize as needed, and remove widgets with
X. - Click Done when layout changes look right.
You can also rename, copy URL, or delete dashboards from the dashboard actions menu in the sidebar.
Programmatic dashboard creation
Use the Dashboard API when you want to provision dashboards from code, seed new environments, or generate dashboards during onboarding.
The API can:
- create an empty dashboard shell
- create a dashboard and its first widgets in one request
- create both SQL-backed query widgets and Explore-backed widgets
- create section headers and free-text widgets for dashboard organization
Inline interactive examples
Example 1: Error rate line chart
Run this in Explore or Query, then pin it with Add to Dashboard.
SELECT
  date_trunc('hour', timestamp_utc) AS hour,
  100.0 * SUM(CASE WHEN status_code >= 500 THEN 1 ELSE 0 END) / COUNT(*) AS error_rate_pct
FROM
  http_logs
WHERE
  timestamp_utc >= now() - INTERVAL '7 days'
GROUP BY
  hour
ORDER BY
  hour ASC
Example 2: Slow endpoints bar chart
Use a Bar chart for ranking. Use it to compare API endpoints or queues.
SELECT
  endpoint,
  AVG(duration_ms) AS avg_duration_ms
FROM
  http_logs
WHERE
  timestamp_utc >= now() - INTERVAL '24 hours'
GROUP BY
  endpoint
ORDER BY
  avg_duration_ms DESC
LIMIT 15
Example 3: Recent failures table
Add this as a table widget next to trend charts to inspect the failures behind a trend.
SELECT
  timestamp_utc,
  service,
  endpoint,
  status_code,
  error_message
FROM
  http_logs
WHERE
  status_code >= 500
  AND timestamp_utc >= now() - INTERVAL '24 hours'
ORDER BY
  timestamp_utc DESC
LIMIT 200
Dashboard design tips
- Keep one primary question per widget. For example, "Are error rates rising?"
- Mix trend widgets with drilldown tables.
- Add section headers before major groups so dashboards stay scannable as they grow.
- Use free-text notes for alerting context, runbook links, or definitions teammates need while debugging.
- Use clear widget titles so teammates can scan the page quickly.
- Start with 4-8 widgets; add more only when each one adds a new decision signal.