Event schema
Fields the query expects
| Field | Type | Why it exists |
|---|---|---|
| timestamp_utc | Timestamp | When the tool call completed. |
| event_name | Utf8 | agent_tool_called for these events. |
| data.tool_name | Utf8 | Nested tool identifier exposed as a dotted column. |
| data.status | Utf8 | Nested success or failed status. |
| data.args.operation | Utf8 | Safe, categorized operation rather than raw arguments. |
| data.latency_ms | Float64 | Nested tool-call latency. |
Copy the query
SELECT
  "data.tool_name" AS tool_name,
  "data.args.operation" AS operation,
  COUNT(*) AS calls,
  SUM(CASE
    WHEN "data.status" = 'failed' THEN 1 ELSE 0
  END) AS failures,
  100.0 * SUM(CASE
    WHEN "data.status" = 'failed' THEN 1 ELSE 0
  END) / NULLIF(COUNT(*), 0) AS failure_rate_pct,
  approx_percentile_cont("data.latency_ms", 0.95) AS p95_latency_ms
FROM agent_events
WHERE event_name = 'agent_tool_called'
  AND timestamp_utc >= now() - INTERVAL '7 days'
GROUP BY "data.tool_name", "data.args.operation"
HAVING COUNT(*) >= 20
ORDER BY failure_rate_pct DESC, calls DESC;
This read-only query is planned and executed against an empty typed table with Apache DataFusion 45.2.0. We review the synthetic sample output separately. Check field types, thresholds, and counting rules against your own data. Read the testing methodology.
Query result
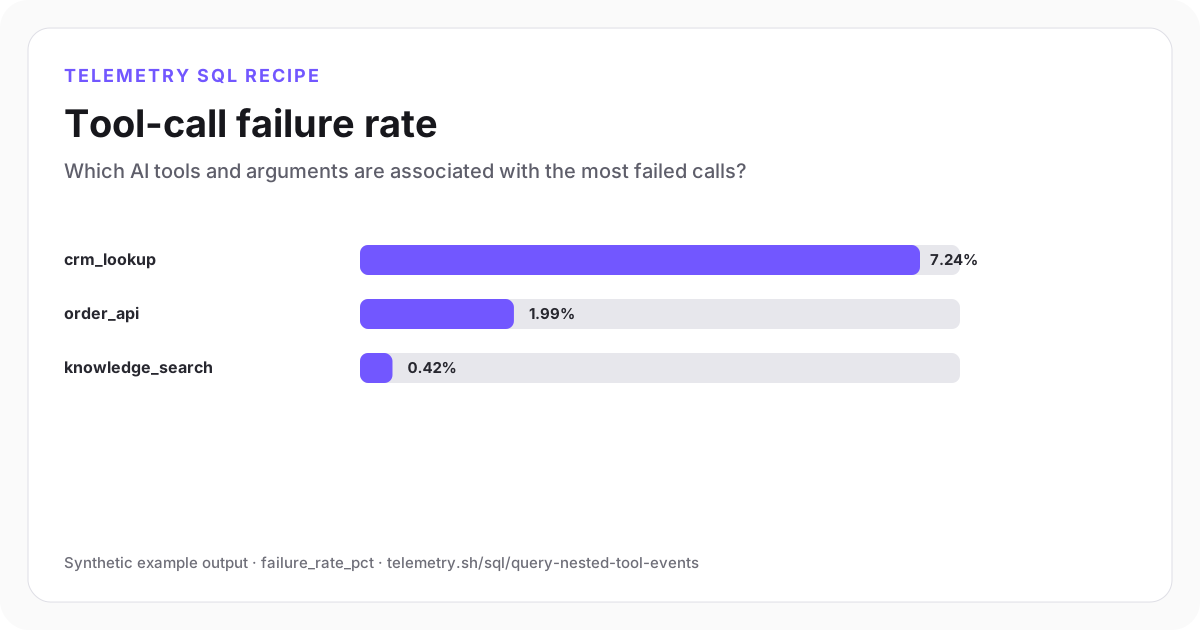
Tool-call failure rate
CRM lookup is both the least reliable tool operation and the slowest at p95.
| tool_name | operation | calls | failures | failure_rate_pct | p95_latency_ms |
|---|---|---|---|---|---|
| crm_lookup | search_contact | 842 | 61 | 7.24 | 2,180 |
| order_api | fetch_order | 2,210 | 44 | 1.99 | 940 |
| knowledge_search | semantic_search | 4,510 | 19 | 0.42 | 720 |
Synthetic example output. Run the query against your own event schema and thresholds before using it for operational decisions.
Reproduce the example
Download the sample data
The JSON bundle includes the event schema with field types, illustrative input rows, exact SQL, expected output, review notes, and engine version. The CSV contains the displayed result.
How the SQL works
- 1Dotted field names are double-quoted because the dots are part of the inferred column name.
- 2The query groups by both tool and categorized operation, preserving enough context to distinguish different behaviors of one tool.
- 3Raw tool arguments should not be logged by default. Store safe categories, identifiers, and outcome fields instead.
Edge cases to check
- Keep nested field types stable as schemas evolve.
- Different tools may have different success semantics; normalize status values at instrumentation time.
- High-cardinality raw arguments can create privacy, cost, and usability problems.
Recommended dashboard
- Bar chart: failure_rate_pct by tool_name
- Line chart: p95_latency_ms over time split by tool
- Table: recent failures with error_type and agent workflow
Alert guidance
Alert when a production tool's failure rate crosses its threshold at meaningful volume, and route the alert to the owning integration.
Read alert setupSet up the events this query needs
Related instrumentation and guides
Define the source data
Event schemas for this analysis
Continue the analysis
Detect missing service heartbeats
Find services, workers, or scheduled tasks that stopped reporting before a failure event appeared.
Open recipeDetect error-rate spikes with a rolling baseline
Compare each hourly API error rate with a rolling seven-bucket average instead of relying on one permanent threshold.
Open recipeReconstruct a correlated workflow timeline
Reconstruct ordered cross-service workflow steps and elapsed time from a shared workflow identifier.
Open recipeRun it on your events
Create a table, adapt the fields, and save the result
Start free, send structured events, and use the query result as a chart, shared dashboard widget, or alert input.