Event schema
Fields the query expects
| Field | Type | Why it exists |
|---|---|---|
| timestamp_utc | Timestamp | Request completion time. |
| status_code | Int64 | HTTP response status code. |
Copy the query
WITH hourly AS (
  SELECT
    date_trunc('hour', timestamp_utc) AS hour,
    COUNT(*) AS requests,
    100.0 * SUM(CASE WHEN status_code >= 500 THEN 1 ELSE 0 END)
      / NULLIF(COUNT(*), 0) AS error_rate_pct
  FROM api_requests
  WHERE timestamp_utc >= now() - INTERVAL '72 hours'
  GROUP BY date_trunc('hour', timestamp_utc)
),
baseline AS (
  SELECT
    hour,
    requests,
    error_rate_pct,
    AVG(error_rate_pct) OVER (
      ORDER BY hour ROWS BETWEEN 7 PRECEDING AND 1 PRECEDING
    ) AS previous_seven_avg_pct
  FROM hourly
)
SELECT
  hour,
  requests,
  error_rate_pct,
  previous_seven_avg_pct,
  error_rate_pct - previous_seven_avg_pct AS increase_pct_points
FROM baseline
WHERE previous_seven_avg_pct IS NOT NULL
ORDER BY hour;
This read-only query is planned and executed against an empty typed table with Apache DataFusion 45.2.0. We review the synthetic sample output separately. Check field types, thresholds, and counting rules against your own data. Read the testing methodology.
Query result
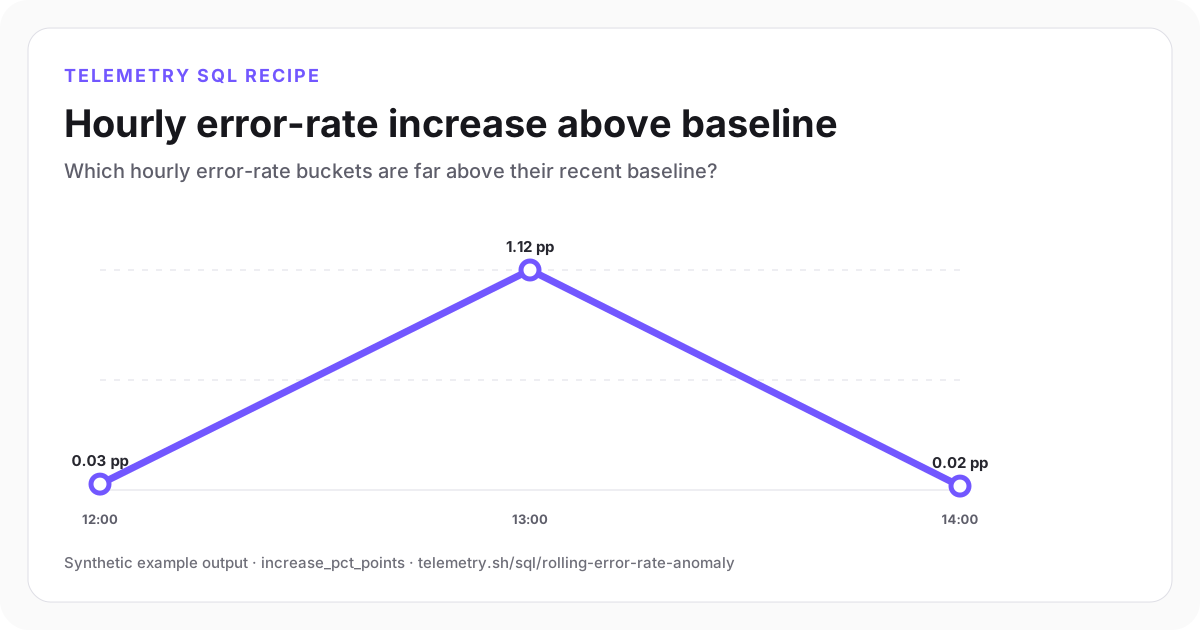
Hourly error-rate increase above baseline
The 13:00 bucket is the only clear positive deviation from the recent rolling average.
12:00
0.03 pp
13:00
1.12 pp
14:00
0.02 pp
| hour | requests | error_rate_pct | previous_seven_avg_pct | increase_pct_points |
|---|---|---|---|---|
| 12:00 | 18,420 | 0.31 | 0.28 | 0.03 |
| 13:00 | 19,110 | 1.42 | 0.3 | 1.12 |
| 14:00 | 18,780 | 0.48 | 0.46 | 0.02 |
Synthetic example output. Run the query against your own event schema and thresholds before using it for operational decisions.
Reproduce the example
Download the sample data
The JSON bundle includes the event schema with field types, illustrative input rows, exact SQL, expected output, review notes, and engine version. The CSV contains the displayed result.
How the SQL works
- 1The hourly CTE computes a ratio with its denominator.
- 2The window ends at one preceding so the current spike cannot raise its own baseline.
- 3The final difference is percentage points, not percent change.
Edge cases to check
- A seven-hour baseline does not model daily seasonality.
- Missing time buckets remain missing; do not silently treat missing traffic as zero errors.
- Require minimum request volume and combine relative change with an absolute impact threshold.
Recommended dashboard
- Trend: observed and rolling error rate
- Bars: increase above baseline
- Table: routes in anomalous buckets
Alert guidance
Alert only when the increase and absolute error rate both exceed thresholds at meaningful volume.
Read alert setupSet up the events this query needs
Related instrumentation and guides
Continue the analysis
Detect missing service heartbeats
Find services, workers, or scheduled tasks that stopped reporting before a failure event appeared.
Open recipeQuery nested AI tool-call events
Filter dotted nested fields and rank failing tools without flattening the original event payload.
Open recipeCalculate API error-budget burn rate
Turn hourly request failures into an SLO burn-rate series that shows how quickly the allowed error budget is being consumed.
Open recipeRun it on your events
Create a table, adapt the fields, and save the result
Start free, send structured events, and use the query result as a chart, shared dashboard widget, or alert input.