Event schema
Fields the query expects
| Field | Type | Why it exists |
|---|---|---|
| timestamp_utc | Timestamp | Replica read completion time. |
| region | Utf8 | Application region. |
| replica_role | Utf8 | primary, replica, or failover target. |
| replay_lag_ms | Float64 | Observed or reported replay lag. |
| consistency_outcome | Utf8 | fresh, stale, failed, or unknown. |
| operation_name | Utf8 | Controlled application read operation. |
Copy the query
SELECT
  region,
  replica_role,
  operation_name,
  COUNT(*) AS reads,
  approx_percentile_cont(replay_lag_ms, 0.95) AS p95_replay_lag_ms,
  SUM(CASE WHEN consistency_outcome = 'stale' THEN 1 ELSE 0 END)
    AS stale_reads,
  SUM(CASE WHEN consistency_outcome = 'failed' THEN 1 ELSE 0 END)
    AS failed_reads
FROM database_replica_read_events
WHERE timestamp_utc >= now() - INTERVAL '24 hours'
GROUP BY region, replica_role, operation_name
ORDER BY stale_reads DESC, p95_replay_lag_ms DESC;
This read-only query is planned and executed against an empty typed table with Apache DataFusion 45.2.0. We review the synthetic sample output separately. Check field types, thresholds, and counting rules against your own data. Read the testing methodology.
Query result
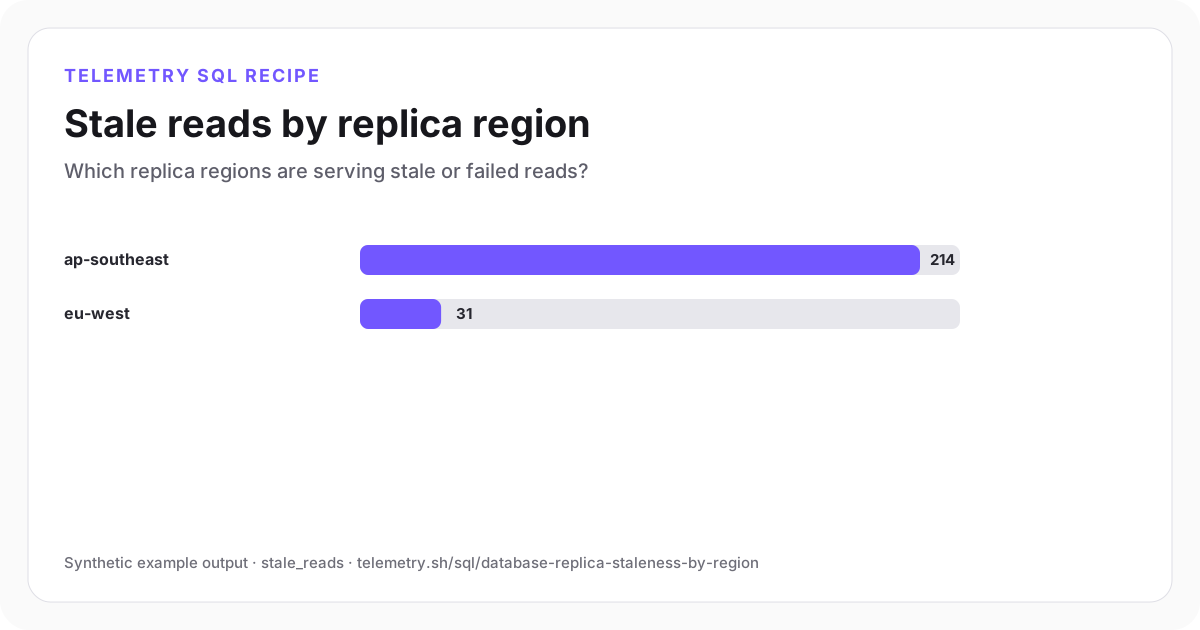
Stale reads by replica region
The ap-southeast subscription read has the highest observed staleness and replay-lag tail.
| region | replica_role | operation_name | reads | p95_replay_lag_ms | stale_reads | failed_reads |
|---|---|---|---|---|---|---|
| ap-southeast | replica | subscription-status | 18,400 | 4,820 | 214 | 18 |
| eu-west | replica | project-list | 42,100 | 740 | 31 | 2 |
Synthetic example output. Run the query against your own event schema and thresholds before using it for operational decisions.
Reproduce the example
Download the sample data
The JSON bundle includes the event schema with field types, illustrative input rows, exact SQL, expected output, review notes, and engine version. The CSV contains the displayed result.
How the SQL works
- 1Replica role and region identify the read path.
- 2Application consistency outcome records user-visible staleness separately from reported lag.
- 3Operation name shows which workflows require stronger read-after-write behavior.
Edge cases to check
- Consistency outcome requires a defensible application check.
- Replay lag units vary by database and collector.
- Database-native replication and failover tooling remains the source for server diagnosis.
Recommended dashboard
- Bars: stale_reads by region
- Trend: p95_replay_lag_ms by role
- Table: failed reads by operation
Alert guidance
Alert when a critical operation serves stale or failed reads beyond its reviewed consistency objective.
Read alert setupSet up the events this query needs
Related instrumentation and guides
Continue the analysis
Find slow database queries by fingerprint
Rank normalized database operations by slow-query rate, average duration, and worst observed duration without storing raw SQL or parameters.
Open recipeMeasure database connection-pool saturation
Measure average pool utilization, queued acquisition waits, timeouts, and idle capacity by application service.
Open recipeCalculate database transaction rollback rate
Compare committed and rolled-back transactions by service while preserving error categories, duration, and affected accounts.
Open recipeRun it on your events
Create a table, adapt the fields, and save the result
Start free, send structured events, and use the query result as a chart, shared dashboard widget, or alert input.