Event schema
Fields the query expects
| Field | Type | Why it exists |
|---|---|---|
| timestamp_utc | Timestamp | When the database operation completed, in UTC. |
| query_fingerprint | Utf8 | A consistent operation label from a fixed list. Exclude parameter values. |
| service | Utf8 | Application or worker that issued the operation. |
| database_name | Utf8 | Approved logical database name. |
| status | Utf8 | success or failed. |
| duration_ms | Float64 | End-to-end database operation duration in milliseconds. |
| rows_returned | Int64 | Rows returned or affected when the client exposes the count. |
| release | Utf8 | Application release that issued the query. |
| environment | Utf8 | Deployment environment. |
Copy the query
SELECT
  query_fingerprint,
  service,
  database_name,
  COUNT(*) AS executions,
  SUM(CASE WHEN duration_ms >= 1000 THEN 1 ELSE 0 END) AS slow_executions,
  100.0 * SUM(CASE WHEN duration_ms >= 1000 THEN 1 ELSE 0 END)
    / NULLIF(COUNT(*), 0) AS slow_query_rate_pct,
  AVG(duration_ms) AS average_duration_ms,
  MAX(duration_ms) AS maximum_duration_ms
FROM database_query_events
WHERE timestamp_utc >= now() - INTERVAL '30 days'
  AND environment = 'production'
GROUP BY query_fingerprint, service, database_name
HAVING COUNT(*) >= 10
ORDER BY slow_query_rate_pct DESC, executions DESC
LIMIT 20;
This read-only query is planned and executed against an empty typed table with Apache DataFusion 45.2.0. We review the synthetic sample output separately. Check field types, thresholds, and counting rules against your own data. Read the testing methodology.
Query result
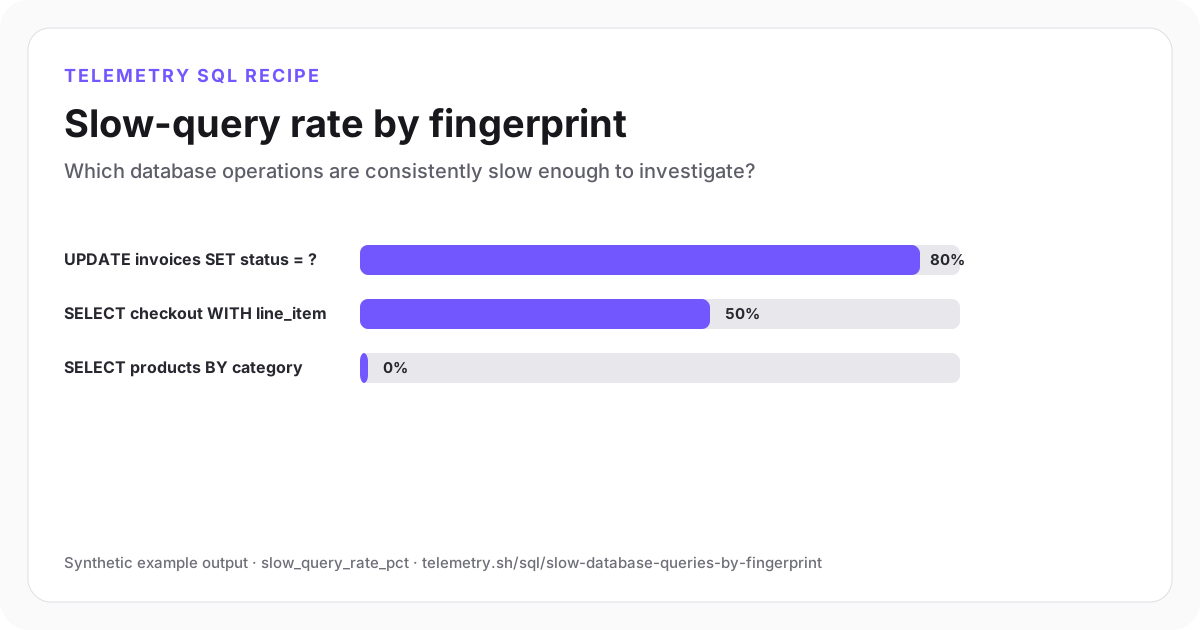
Slow-query rate by fingerprint
The invoice update is slow on most executions, while the catalog query remains below the illustrative one-second threshold.
| query_fingerprint | service | database_name | executions | slow_executions | slow_query_rate_pct | average_duration_ms | maximum_duration_ms |
|---|---|---|---|---|---|---|---|
| UPDATE invoices SET status = ? | billing-worker | app_production | 10 | 8 | 80 | 1,250 | 1,700 |
| SELECT checkout WITH line_items | checkout-api | app_production | 12 | 6 | 50 | 1,012.5 | 1,600 |
| SELECT products BY category | catalog-api | catalog_production | 12 | 0 | 0 | 330 | 440 |
Synthetic example output. Run the query against your own event schema and thresholds before using it for operational decisions.
Reproduce the example
Download the sample data
The JSON bundle includes the event schema with field types, reproducible input rows, exact SQL, expected output, review notes, and engine version. The CSV contains the displayed result.
How the SQL works
- 1The fingerprint is an application-controlled label, not raw SQL. That bounds cardinality and avoids capturing parameter values.
- 2A rate distinguishes an occasionally slow high-volume operation from an operation that is slow most of the time.
- 3The minimum execution count prevents a single cold query from dominating the ranking.
Edge cases to check
- Choose a slow threshold per workload; one second is illustrative and may be far too high for an interactive request.
- Client duration includes pool wait and network time unless those phases are recorded separately.
- Do not log raw query parameters, connection strings, or unrestricted SQL text.
Recommended dashboard
- Bars: slow_query_rate_pct by query_fingerprint
- Trend: average_duration_ms by release
- Table: newest failures for a selected fingerprint and service
Alert guidance
Alert when a high-volume fingerprint remains above its reviewed slow-query rate for several complete buckets.
Read alert setupSet up the events this query needs
Related instrumentation and guides
Define the source data
Event schemas for this analysis
Continue the analysis
Measure database connection-pool saturation
Measure average pool utilization, queued acquisition waits, timeouts, and idle capacity by application service.
Open recipeCalculate database transaction rollback rate
Compare committed and rolled-back transactions by service while preserving error categories, duration, and affected accounts.
Open recipeFind database lock waits and deadlocks
Rank blocked database operation fingerprints by incident count, wait duration, unresolved locks, and detected deadlocks.
Open recipeRun it on your events
Create a table, adapt the fields, and save the result
Start free, send structured events, and use the query result as a chart, shared dashboard widget, or alert input.