Event schema
Fields the query expects
| Field | Type | Why it exists |
|---|---|---|
| timestamp_utc | Timestamp | Pool sample time in UTC. |
| service | Utf8 | Application service that owns the pool. |
| pool_name | Utf8 | Stable logical pool name. |
| active_connections | Int64 | Connections currently checked out. |
| idle_connections | Int64 | Open connections currently idle. |
| max_connections | Int64 | Configured maximum pool size. |
| wait_ms | Float64 | Observed connection-acquisition wait for this sample. |
| timed_out | Boolean | Whether acquisition exceeded the client timeout. |
| environment | Utf8 | Deployment environment. |
Copy the query
SELECT
  service,
  pool_name,
  COUNT(*) AS samples,
  100.0 * AVG(active_connections)
    / NULLIF(MAX(max_connections), 0) AS average_utilization_pct,
  SUM(CASE WHEN wait_ms > 0 THEN 1 ELSE 0 END) AS waited_samples,
  100.0 * SUM(CASE WHEN wait_ms > 0 THEN 1 ELSE 0 END)
    / NULLIF(COUNT(*), 0) AS wait_rate_pct,
  AVG(wait_ms) AS average_wait_ms,
  SUM(CASE WHEN timed_out THEN 1 ELSE 0 END) AS timeouts
FROM database_pool_samples
WHERE timestamp_utc >= now() - INTERVAL '24 hours'
  AND environment = 'production'
GROUP BY service, pool_name
HAVING COUNT(*) >= 10
ORDER BY wait_rate_pct DESC, average_utilization_pct DESC;
This read-only query is planned and executed against an empty typed table with Apache DataFusion 45.2.0. We review the synthetic sample output separately. Check field types, thresholds, and counting rules against your own data. Read the testing methodology.
Query result
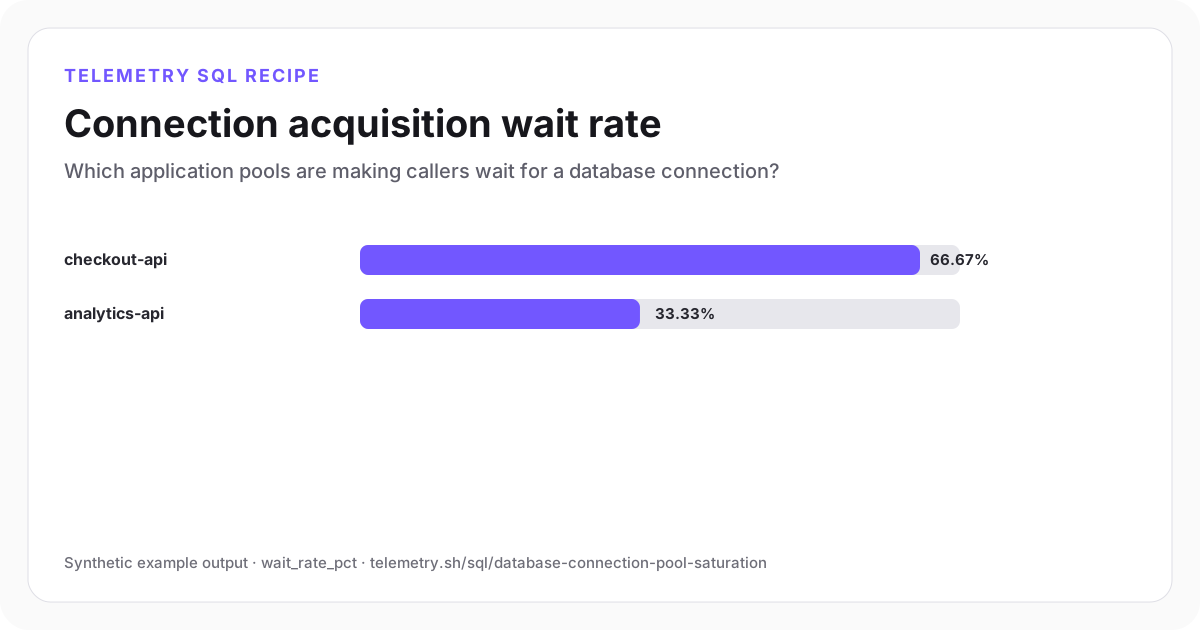
Connection acquisition wait rate
Checkout callers wait in two-thirds of the samples and also experience acquisition timeouts.
| service | pool_name | samples | average_utilization_pct | waited_samples | wait_rate_pct | average_wait_ms | timeouts |
|---|---|---|---|---|---|---|---|
| checkout-api | primary | 12 | 89.17 | 8 | 66.67 | 118.75 | 2 |
| analytics-api | reporting | 12 | 45 | 4 | 33.33 | 12.5 | 0 |
Synthetic example output. Run the query against your own event schema and thresholds before using it for operational decisions.
Reproduce the example
Download the sample data
The JSON bundle includes the event schema with field types, reproducible input rows, exact SQL, expected output, review notes, and engine version. The CSV contains the displayed result.
How the SQL works
- 1Use average utilization to check capacity. It does not establish a failure on its own.
- 2The waited-sample rate shows how frequently callers encounter contention even when the wait remains short.
- 3Timeouts remain explicit because an average can hide a smaller set of requests that never acquire a connection.
Edge cases to check
- Sampling frequency must remain stable before comparing rates across services.
- Serverless concurrency can create many independent pools; include an instance or runtime dimension when aggregation would hide that shape.
- Increasing pool size can move contention into the database. Check database capacity before changing the client limit.
Recommended dashboard
- Bars: wait_rate_pct and average_utilization_pct by service
- Trend: active, idle, and waiting connections
- Stat: connection-acquisition timeouts
Alert guidance
Alert when wait rate and timeouts remain elevated across consecutive samples, then validate database capacity before increasing the pool.
Read alert setupSet up the events this query needs
Related instrumentation and guides
Continue the analysis
Find slow database queries by fingerprint
Rank normalized database operations by slow-query rate, average duration, and worst observed duration without storing raw SQL or parameters.
Open recipeCalculate database transaction rollback rate
Compare committed and rolled-back transactions by service while preserving error categories, duration, and affected accounts.
Open recipeFind database lock waits and deadlocks
Rank blocked database operation fingerprints by incident count, wait duration, unresolved locks, and detected deadlocks.
Open recipeRun it on your events
Create a table, adapt the fields, and save the result
Start free, send structured events, and use the query result as a chart, shared dashboard widget, or alert input.