Event schema
Fields the query expects
| Field | Type | Why it exists |
|---|---|---|
| timestamp_utc | Timestamp | Replication sample time in UTC. |
| consumer_name | Utf8 | Stable replica, connector, or downstream consumer name. |
| source_type | Utf8 | postgres_replica, cdc_pipeline, or another controlled source type. |
| region | Utf8 | Approved deployment region. |
| lag_seconds | Float64 | Observed time lag behind the source. |
| replay_bytes_behind | Int64 | Approximate bytes waiting to be replayed or consumed. |
| status | Utf8 | healthy, lagging, stalled, or unavailable. |
| environment | Utf8 | Deployment environment. |
Copy the query
SELECT
  consumer_name,
  source_type,
  region,
  COUNT(*) AS samples,
  AVG(lag_seconds) AS average_lag_seconds,
  MAX(lag_seconds) AS maximum_lag_seconds,
  MAX(replay_bytes_behind) AS maximum_bytes_behind,
  SUM(CASE WHEN lag_seconds > 30 THEN 1 ELSE 0 END) AS stale_samples,
  100.0 * SUM(CASE WHEN lag_seconds > 30 THEN 1 ELSE 0 END)
    / NULLIF(COUNT(*), 0) AS stale_sample_rate_pct
FROM database_replication_samples
WHERE timestamp_utc >= now() - INTERVAL '24 hours'
  AND environment = 'production'
GROUP BY consumer_name, source_type, region
HAVING COUNT(*) >= 10
ORDER BY maximum_lag_seconds DESC;
This read-only query is planned and executed against an empty typed table with Apache DataFusion 45.2.0. We review the synthetic sample output separately. Check field types, thresholds, and counting rules against your own data. Read the testing methodology.
Query result
Maximum replication or CDC lag
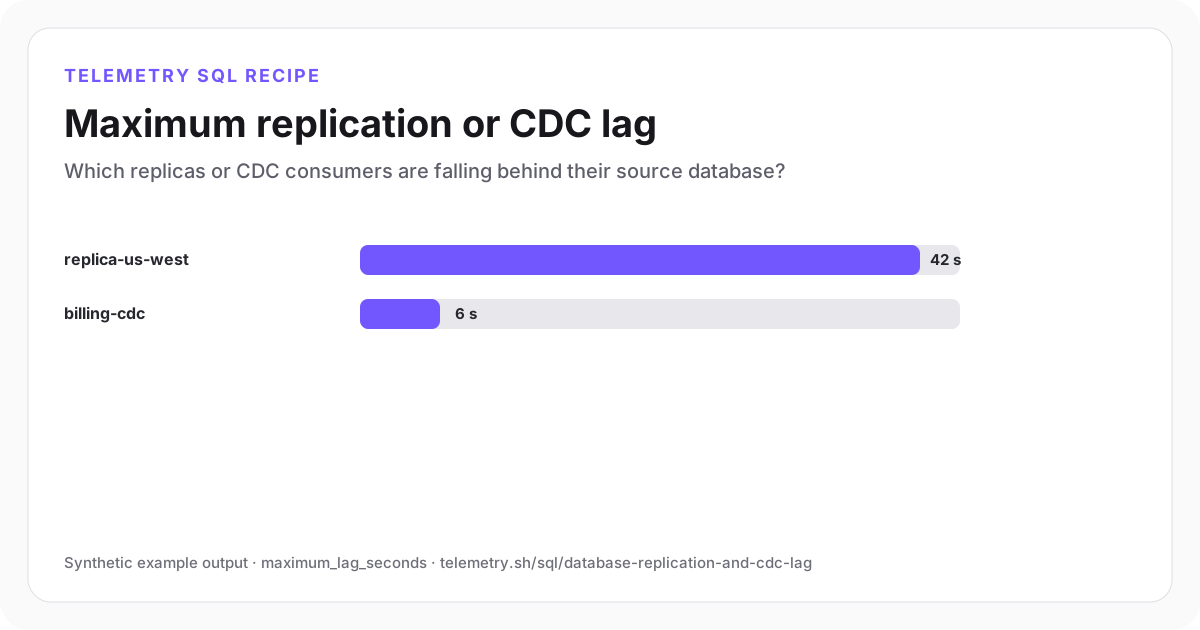
The west-region replica exceeds the illustrative thirty-second freshness threshold in two samples.
| consumer_name | source_type | region | samples | average_lag_seconds | maximum_lag_seconds | maximum_bytes_behind | stale_samples | stale_sample_rate_pct |
|---|---|---|---|---|---|---|---|---|
| replica-us-west | postgres_replica | us-west | 12 | 14.58 | 42 | 44,040,192 | 2 | 16.67 |
| billing-cdc | cdc_pipeline | us-east | 12 | 3 | 6 | 6,291,456 | 0 | 0 |
Synthetic example output. Run the query against your own event schema and thresholds before using it for operational decisions.
Reproduce the example
Download the sample data
The JSON bundle includes the event schema with field types, reproducible input rows, exact SQL, expected output, review notes, and engine version. The CSV contains the displayed result.
How the SQL works
- 1Average lag describes the normal state while maximum lag preserves short but consequential stalls.
- 2A stale-sample rate is easier to alert on than one isolated maximum.
- 3Bytes behind supplies workload context because the same delay can represent very different amounts of replay work.
Edge cases to check
- Database lag fields can mean write, flush, replay, or connector delay. Specify which delay each field measures.
- A quiet source can report low bytes behind while still being stale; keep both time and volume.
- Use a workload-specific freshness objective rather than one global thirty-second threshold.
Recommended dashboard
- Bars: maximum_lag_seconds by consumer
- Trend: lag_seconds and replay_bytes_behind
- Table: newest lagging or unavailable consumers
Alert guidance
Alert when a consumer exceeds its documented freshness objective for consecutive samples or stops reporting entirely.
Read alert setupSet up the events this query needs
Related instrumentation and guides
Continue the analysis
Measure event ingestion freshness
Find event sources that stopped delivering data or are arriving substantially later than they occurred.
Open recipeFind slow database queries by fingerprint
Rank normalized database operations by slow-query rate, average duration, and worst observed duration without storing raw SQL or parameters.
Open recipeMeasure database connection-pool saturation
Measure average pool utilization, queued acquisition waits, timeouts, and idle capacity by application service.
Open recipeRun it on your events
Create a table, adapt the fields, and save the result
Start free, send structured events, and use the query result as a chart, shared dashboard widget, or alert input.