Event schema
Fields the query expects
| Field | Type | Why it exists |
|---|---|---|
| timestamp_utc | Timestamp | Cache lookup completion time in UTC. |
| cache_key_pattern | Utf8 | Bounded pattern such as product:{id}, never a raw key. |
| cache_hit | Boolean | Whether the lookup returned a cached value. |
| concurrent_misses | Int64 | Observed in-flight fills for the same pattern. |
| backend_duration_ms | Float64 | Fallback duration; zero for a hit. |
| environment | Utf8 | Deployment environment. |
Copy the query
SELECT
  cache_key_pattern,
  COUNT(*) AS requests,
  SUM(CASE WHEN cache_hit THEN 1 ELSE 0 END) AS hits,
  SUM(CASE WHEN cache_hit THEN 0 ELSE 1 END) AS misses,
  100.0 * SUM(CASE WHEN cache_hit THEN 0 ELSE 1 END)
    / NULLIF(COUNT(*), 0) AS miss_rate_pct,
  MAX(concurrent_misses) AS maximum_concurrent_misses,
  AVG(CASE WHEN cache_hit THEN NULL ELSE backend_duration_ms END)
    AS average_backend_duration_ms
FROM cache_request_events
WHERE timestamp_utc >= now() - INTERVAL '24 hours'
  AND environment = 'production'
GROUP BY cache_key_pattern
ORDER BY maximum_concurrent_misses DESC, cache_key_pattern;
This read-only query is planned and executed against an empty typed table with Apache DataFusion 45.2.0. We review the synthetic sample output separately. Check field types, thresholds, and counting rules against your own data. Read the testing methodology.
Query result
Cache miss and stampede indicators
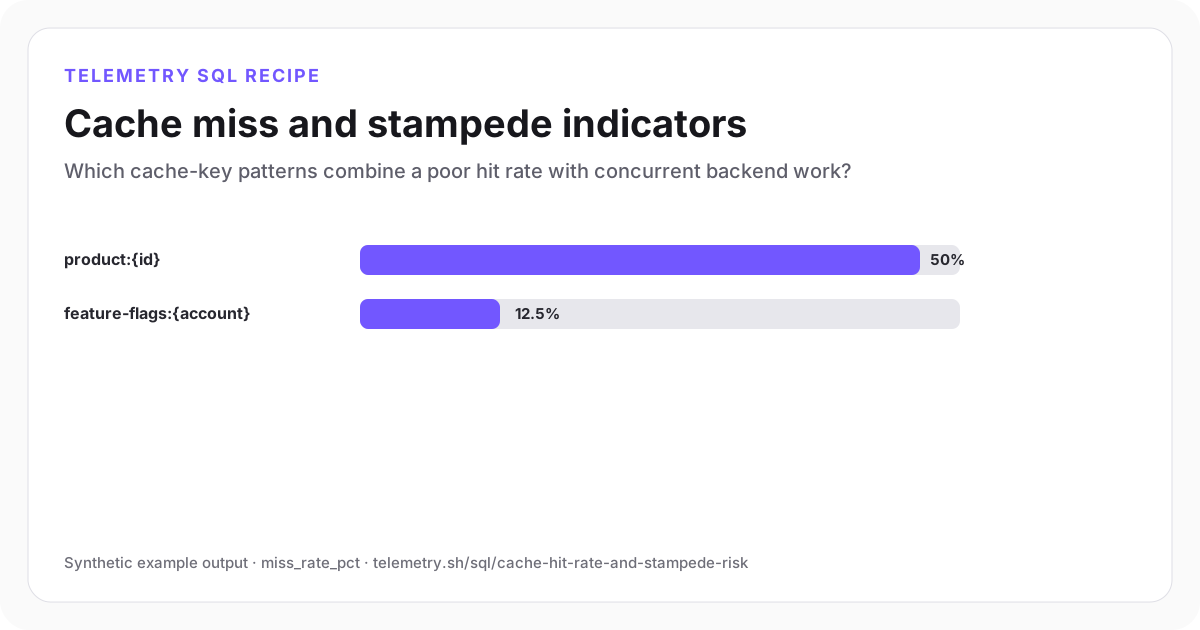
Product lookups combine a 50% miss rate with 31 concurrent fills and the higher backend cost.
| cache_key_pattern | requests | hits | misses | miss_rate_pct | maximum_concurrent_misses | average_backend_duration_ms |
|---|---|---|---|---|---|---|
| product:{id} | 10 | 5 | 5 | 50 | 31 | 232 |
| feature-flags:{account} | 8 | 7 | 1 | 12.5 | 7 | 75 |
Synthetic example output. Run the query against your own event schema and thresholds before using it for operational decisions.
Reproduce the example
Download the sample data
The JSON bundle includes the event schema with field types, reproducible input rows, exact SQL, expected output, review notes, and engine version. The CSV contains the displayed result.
How the SQL works
- 1Group by a fixed set of cache-key patterns your app defines. Raw cache keys would create too many groups.
- 2Miss rate captures efficiency while maximum concurrent misses exposes burst behavior.
- 3Backend duration is averaged only for misses because hits do not execute the fallback.
Edge cases to check
- Define concurrent_misses consistently at lookup time or fill start.
- Split cold-start deployments from steady-state traffic when cache warming is expected.
- Use percentiles rather than averages when backend duration has a heavy tail.
Recommended dashboard
- Scatter plot: miss_rate_pct versus maximum_concurrent_misses
- Trend: misses and backend duration by cache-key pattern
- Table of cache-key patterns with the most backend work
Alert guidance
Alert when concurrent misses and backend duration rise together for a material request volume.
Read alert setupSet up the events this query needs
Related instrumentation and guides
Continue the analysis
Find host and container resource saturation
Rank infrastructure sources by sustained CPU, memory, and disk utilization while preserving sample volume.
Open recipeMeasure database connection-pool saturation
Measure average pool utilization, queued acquisition waits, timeouts, and idle capacity by application service.
Open recipeCalculate incident detection and recovery time
Calculate time to detect and time to recover from structured incident lifecycle events.
Open recipeRun it on your events
Create a table, adapt the fields, and save the result
Start free, send structured events, and use the query result as a chart, shared dashboard widget, or alert input.