Event schema
Fields the query expects
| Field | Type | Why it exists |
|---|---|---|
| timestamp_utc | Timestamp | Metric sample time in UTC. |
| source | Utf8 | Stable host, service, or container identifier. |
| environment | Utf8 | Deployment environment. |
| cpu_utilization_pct | Float64 | CPU utilization from 0 to 100. |
| memory_utilization_pct | Float64 | Memory utilization from 0 to 100. |
| disk_utilization_pct | Float64 | Disk utilization from 0 to 100. |
Copy the query
SELECT
  date_trunc('hour', timestamp_utc) AS hour,
  source,
  COUNT(*) AS samples,
  AVG(cpu_utilization_pct) AS average_cpu_pct,
  MAX(cpu_utilization_pct) AS maximum_cpu_pct,
  AVG(memory_utilization_pct) AS average_memory_pct,
  MAX(memory_utilization_pct) AS maximum_memory_pct,
  MAX(disk_utilization_pct) AS maximum_disk_pct
FROM system_metrics
WHERE timestamp_utc >= now() - INTERVAL '24 hours'
  AND environment = 'production'
GROUP BY date_trunc('hour', timestamp_utc), source
HAVING COUNT(*) >= 6
  AND (
    AVG(cpu_utilization_pct) >= 80.0
    OR AVG(memory_utilization_pct) >= 85.0
    OR MAX(disk_utilization_pct) >= 90.0
  )
ORDER BY average_cpu_pct DESC, average_memory_pct DESC;
This read-only query is planned and executed against an empty typed table with Apache DataFusion 45.2.0. We review the synthetic sample output separately. Check field types, thresholds, and counting rules against your own data. Read the testing methodology.
Query result
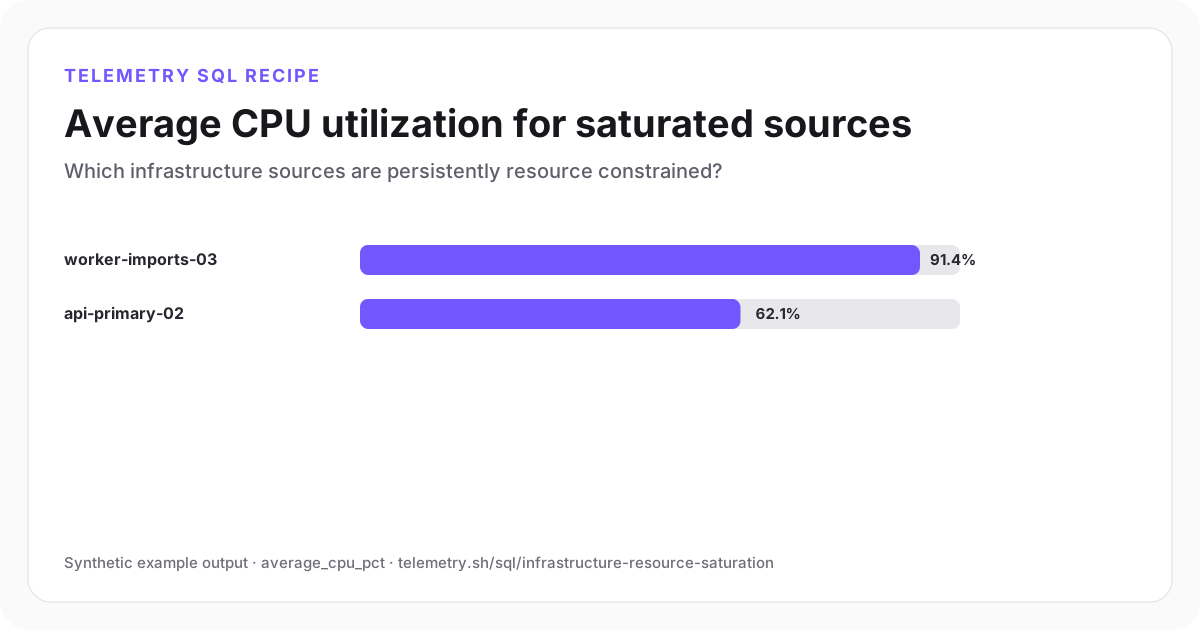
Average CPU utilization for saturated sources
The import worker is CPU constrained, while the API source entered the result because of sustained memory pressure.
| hour | source | samples | average_cpu_pct | maximum_cpu_pct | average_memory_pct | maximum_memory_pct | maximum_disk_pct |
|---|---|---|---|---|---|---|---|
| 2026-07-27 14:00 | worker-imports-03 | 60 | 91.4 | 99.2 | 78.8 | 84.1 | 66.2 |
| 2026-07-27 14:00 | api-primary-02 | 60 | 62.1 | 88.4 | 89.3 | 93.6 | 72.5 |
Synthetic example output. Run the query against your own event schema and thresholds before using it for operational decisions.
Reproduce the example
Download the sample data
The JSON bundle includes the event schema with field types, illustrative input rows, exact SQL, expected output, review notes, and engine version. The CSV contains the displayed result.
How the SQL works
- 1Hourly grouping reduces individual-sample noise while keeping the affected time window visible.
- 2Average CPU and memory show sustained pressure. Use maximum disk utilization to catch a full disk that an average could hide.
- 3A sample minimum prevents a partially reporting source from appearing healthy or saturated based on too little data.
Edge cases to check
- Container CPU percentages can exceed 100 when the source reports utilization across several cores; normalize the contract first.
- Memory pressure depends on reclaimable cache and workload behavior, not only a universal percentage.
- Missing samples require a separate heartbeat or ingestion-freshness view.
Recommended dashboard
- Bars: average CPU and memory by source
- Trend: maximum disk utilization
- Table: saturated sources with sample count and owning service
Alert guidance
Alert only when sustained utilization and a user-facing symptom such as latency, queue age, or errors breach their objectives together.
Read alert setupSet up the events this query needs
Related instrumentation and guides
Continue the analysis
Detect missing service heartbeats
Find services, workers, or scheduled tasks that stopped reporting before a failure event appeared.
Open recipeCompare dependency p95 latency
Find databases, APIs, caches, and queues contributing the most tail latency to requests.
Open recipeFind cache misses and stampede risk
Compare hit rate, backend cost, and concurrent misses by approved cache-key pattern.
Open recipeRun it on your events
Create a table, adapt the fields, and save the result
Start free, send structured events, and use the query result as a chart, shared dashboard widget, or alert input.