Event schema
Fields the query expects
| Field | Type | Why it exists |
|---|---|---|
| timestamp_utc | Timestamp | Lifecycle event time in UTC. |
| incident_id | Utf8 | Stable incident identifier. |
| service | Utf8 | Primary affected service. |
| event_name | Utf8 | impact_started, detected, or resolved. |
| severity | Utf8 | Reviewed incident severity. |
| environment | Utf8 | Deployment environment. |
Copy the query
WITH incident_times AS (
  SELECT
    incident_id,
    service,
    MIN(CASE WHEN event_name = 'impact_started' THEN timestamp_utc END)
      AS impact_started_at,
    MIN(CASE WHEN event_name = 'detected' THEN timestamp_utc END)
      AS detected_at,
    MAX(CASE WHEN event_name = 'resolved' THEN timestamp_utc END)
      AS resolved_at
  FROM incident_lifecycle_events
  WHERE timestamp_utc >= now() - INTERVAL '90 days'
    AND environment = 'production'
  GROUP BY incident_id, service
)
SELECT
  service,
  COUNT(*) AS incidents,
  AVG(date_part('epoch', detected_at - impact_started_at) / 60.0)
    AS average_detection_minutes,
  AVG(date_part('epoch', resolved_at - detected_at) / 60.0)
    AS average_recovery_minutes
FROM incident_times
WHERE impact_started_at IS NOT NULL
  AND detected_at IS NOT NULL
  AND resolved_at IS NOT NULL
GROUP BY service
ORDER BY average_recovery_minutes DESC, service;
This read-only query is planned and executed against an empty typed table with Apache DataFusion 45.2.0. We review the synthetic sample output separately. Check field types, thresholds, and counting rules against your own data. Read the testing methodology.
Query result
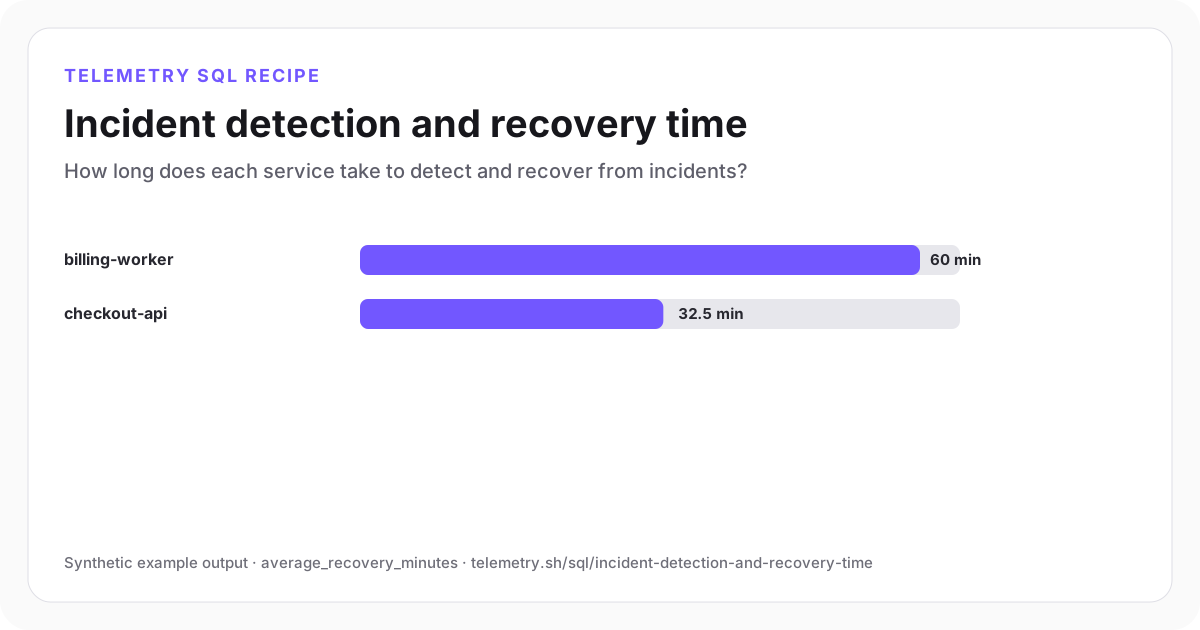
Incident detection and recovery time
Billing-worker has the longer observed detection and recovery intervals.
| service | incidents | average_detection_minutes | average_recovery_minutes |
|---|---|---|---|
| billing-worker | 1 | 15 | 60 |
| checkout-api | 2 | 7.5 | 32.5 |
Synthetic example output. Run the query against your own event schema and thresholds before using it for operational decisions.
Reproduce the example
Download the sample data
The JSON bundle includes the event schema with field types, reproducible input rows, exact SQL, expected output, review notes, and engine version. The CSV contains the displayed result.
How the SQL works
- 1Lifecycle events are pivoted to one row per incident before duration calculations.
- 2Detection measures impact start to detection; recovery measures detection to resolution.
- 3Incomplete incidents are excluded from the completed-duration average and should be reported separately.
Edge cases to check
- Define whether recovery ends at mitigation, full restoration, or incident closure and use one rule consistently.
- Reopened incidents may need multiple impact intervals rather than one maximum resolved time.
- Averages are illustrative; report medians and percentiles when incident volume is sufficient.
Recommended dashboard
- Bars: average detection and recovery minutes by service
- Trend: completed incident durations by month
- Table: open incidents missing a resolved event
Alert guidance
Use operational alerts for live impact; use this result as a response-quality review and trend metric.
Read alert setupSet up the events this query needs
Related instrumentation and guides
Continue the analysis
Find host and container resource saturation
Rank infrastructure sources by sustained CPU, memory, and disk utilization while preserving sample volume.
Open recipeFind cache misses and stampede risk
Compare hit rate, backend cost, and concurrent misses by approved cache-key pattern.
Open recipeFind Kubernetes restarts by workload
Rank Kubernetes workloads by container restart events, readiness failures, and observed cumulative restart count.
Open recipeRun it on your events
Create a table, adapt the fields, and save the result
Start free, send structured events, and use the query result as a chart, shared dashboard widget, or alert input.