Event schema
Fields the query expects
| Field | Type | Why it exists |
|---|---|---|
| timestamp_utc | Timestamp | Activity time. |
| user_id | Utf8 | Stable actor identifier. |
| event_name | Utf8 | Qualifying product action. |
Copy the query
WITH daily_users AS (
  SELECT DISTINCT
    date_trunc('day', timestamp_utc) AS activity_day,
    user_id
  FROM product_events
  WHERE timestamp_utc >= now() - INTERVAL '35 days'
    AND event_name IN ('feature_used', 'dashboard_viewed', 'query_run')
),
days AS (
  SELECT DISTINCT activity_day
  FROM daily_users
),
activity AS (
  SELECT
    days.activity_day,
    COUNT(DISTINCT CASE
      WHEN daily_users.activity_day = days.activity_day
      THEN daily_users.user_id
    END) AS dau,
    COUNT(DISTINCT daily_users.user_id) AS wau
  FROM days
  JOIN daily_users
    ON daily_users.activity_day BETWEEN
      days.activity_day - INTERVAL '6 days' AND days.activity_day
  GROUP BY days.activity_day
)
SELECT
  activity_day,
  dau,
  wau,
  100.0 * dau / NULLIF(wau, 0) AS stickiness_pct
FROM activity
ORDER BY activity_day;
This read-only query is planned and executed against an empty typed table with Apache DataFusion 45.2.0. We review the synthetic sample output separately. Check field types, thresholds, and counting rules against your own data. Read the testing methodology.
Query result
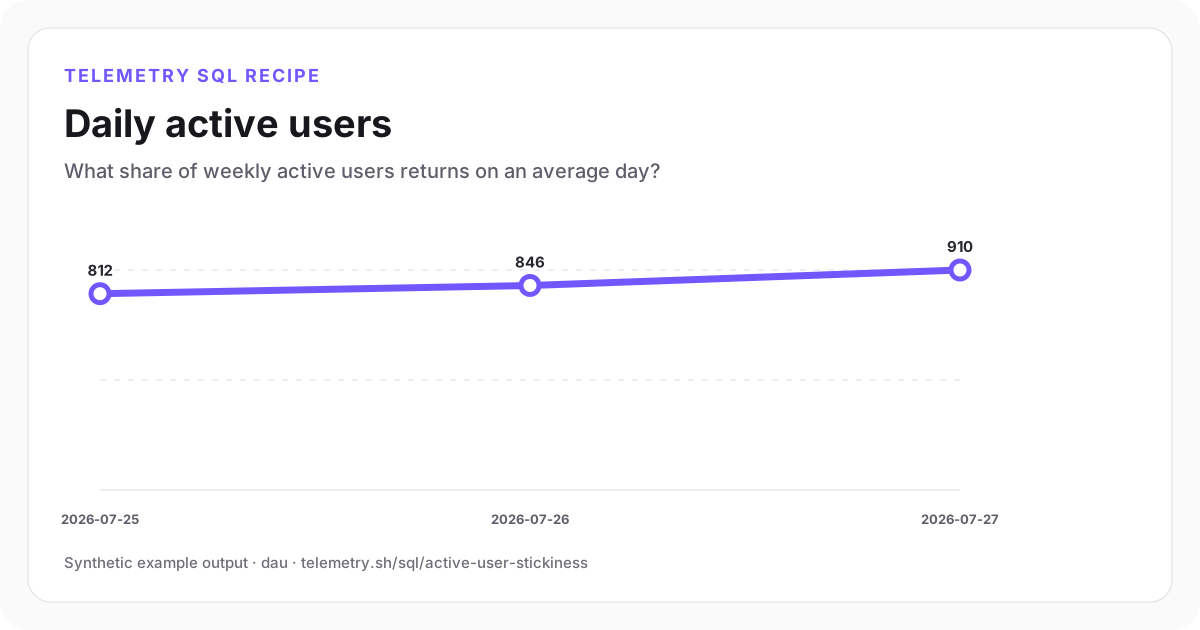
Daily active users
Daily activity increased across the final three complete days.
2026-07-25
812
2026-07-26
846
2026-07-27
910
| activity_day | dau | wau | stickiness_pct |
|---|---|---|---|
| 2026-07-25 | 812 | 5,120 | 15.86 |
| 2026-07-26 | 846 | 5,244 | 16.13 |
| 2026-07-27 | 910 | 5,408 | 16.83 |
Synthetic example output. Run the query against your own event schema and thresholds before using it for operational decisions.
Reproduce the example
Download the sample data
The JSON bundle includes the event schema with field types, illustrative input rows, exact SQL, expected output, review notes, and engine version. The CSV contains the displayed result.
How the SQL works
- 1The first CTE deduplicates repeated qualifying events by user and day.
- 2Joining each reporting day to the preceding seven activity days produces an exact distinct WAU denominator.
- 3Stickiness is the day's distinct active users divided by that day's rolling distinct weekly active users.
Edge cases to check
- Do not use page views or sign-ins if they are inconsistent proxies for meaningful activity.
- Anonymous-to-identified user merging changes distinct counts.
- Exclude incomplete current days from reporting comparisons.
Recommended dashboard
- Trend: DAU and exact WAU
- Stat: DAU/WAU stickiness
- Table: active users by plan or acquisition source
Alert guidance
Use anomaly or sustained-change review rather than paging on normal daily engagement variation.
Read alert setupSet up the events this query needs
Related instrumentation and guides
Continue the analysis
Count recorded steps in a student prototype
Run SQL on 18 fictional event rows from eight toy trials. Count distinct trials at each step without mistaking a missing event for proof of abandonment.
Open recipeBuild a signup-to-activation funnel in SQL
Calculate unique-user conversion through signup, onboarding, integration, and first-value milestones.
Open recipeCalculate weekly cohort retention
Group users by first activity week and measure the percentage returning in later weeks.
Open recipeRun it on your events
Create a table, adapt the fields, and save the result
Start free, send structured events, and use the query result as a chart, shared dashboard widget, or alert input.