Event schema
Fields the query expects
| Field | Type | Why it exists |
|---|---|---|
| timestamp_utc | Timestamp | Ingestion attempt time in UTC. |
| event_name | Utf8 | Controlled event name. |
| source | Utf8 | Bounded producer or SDK source. |
| payload_bytes | Int64 | Serialized event size before transport compression. |
| accepted | Boolean | Whether ingestion accepted the event. |
| environment | Utf8 | Deployment environment. |
Copy the query
SELECT
  event_name,
  source,
  COUNT(*) AS events,
  SUM(payload_bytes) AS total_payload_bytes,
  AVG(payload_bytes) AS avg_payload_bytes,
  SUM(CASE WHEN accepted THEN 0 ELSE 1 END) AS rejected_events,
  100.0 * SUM(CASE WHEN accepted THEN 0 ELSE 1 END)
    / NULLIF(COUNT(*), 0) AS rejection_rate_pct
FROM telemetry_ingestion_events
WHERE timestamp_utc >= now() - INTERVAL '24 hours'
  AND environment = 'production'
GROUP BY event_name, source
ORDER BY total_payload_bytes DESC, event_name;
This read-only query is planned and executed against an empty typed table with Apache DataFusion 45.2.0. We review the synthetic sample output separately. Check field types, thresholds, and counting rules against your own data. Read the testing methodology.
Query result
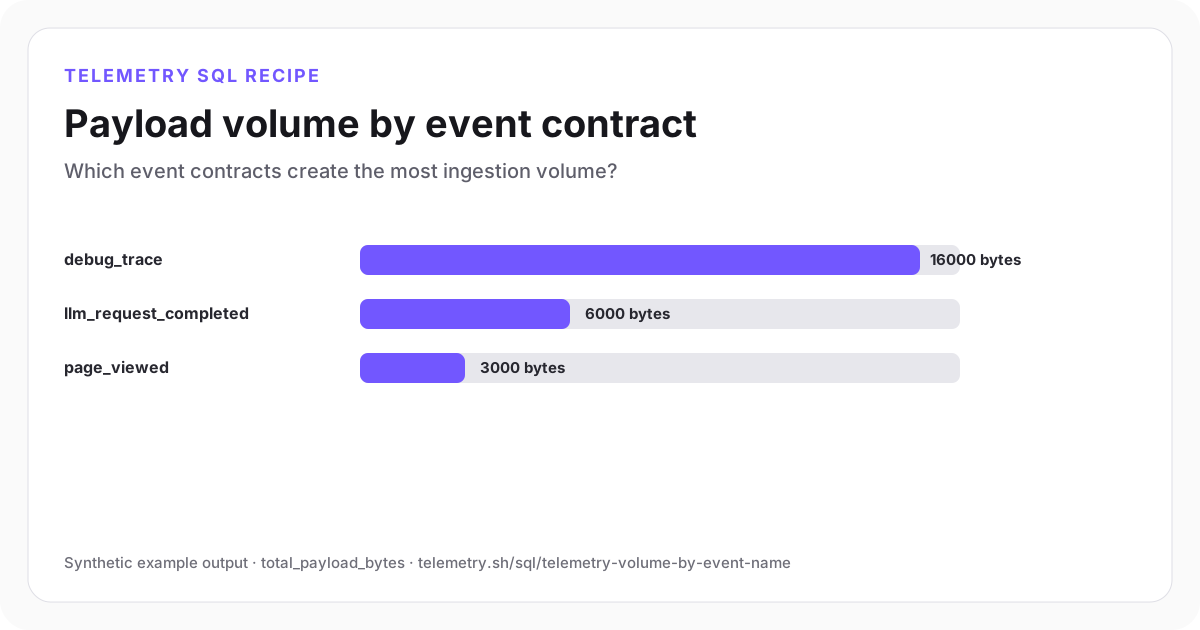
Payload volume by event contract
The synthetic debug trace has the largest byte volume despite having fewer events than page views.
| event_name | source | events | total_payload_bytes | avg_payload_bytes | rejected_events | rejection_rate_pct |
|---|---|---|---|---|---|---|
| debug_trace | worker | 4 | 16,000 | 4,000 | 1 | 25 |
| llm_request_completed | api | 3 | 6,000 | 2,000 | 0 | 0 |
| page_viewed | web | 6 | 3,000 | 500 | 1 | 16.67 |
Synthetic example output. Run the query against your own event schema and thresholds before using it for operational decisions.
Reproduce the example
Download the sample data
The JSON bundle includes the event schema with field types, reproducible input rows, exact SQL, expected output, review notes, and engine version. The CSV contains the displayed result.
How the SQL works
- 1Total and average event bytes show whether a table grows because of event volume or large individual events.
- 2Source keeps ownership visible when the same event name can be emitted by multiple producers.
- 3Rejection rate turns collection changes into a data-quality review instead of a cost-only exercise.
Edge cases to check
- Serialized payload size is not stored size, scan bytes, network egress, or invoice cost.
- Measure dimension cardinality separately; a small event can still create expensive or unusable groups.
- Exclude synthetic and development traffic before changing production retention.
Recommended dashboard
- Bars: total_payload_bytes by event_name
- Trend: event count and bytes by source
- Table: average size, rejection rate, retention owner, and schema version
Alert guidance
Alert when event size or volume stays above its reviewed baseline. Use a threshold for each event type.
Read alert setupSet up the events this query needs
Related instrumentation and guides
Continue the analysis
Count sensor deliveries and measurements separately
Run SQL on six fictional sensor deliveries. A network retry adds rows without adding measurements, changing a row-weighted average.
Open recipeMeasure event ingestion freshness
Find event sources that stopped delivering data or are arriving substantially later than they occurred.
Open recipeFind duplicate event ids
Identify event identifiers delivered more than once and measure whether duplicate handling is working.
Open recipeRun it on your events
Create a table, adapt the fields, and save the result
Start free, send structured events, and use the query result as a chart, shared dashboard widget, or alert input.