Event schema
Fields the query expects
| Field | Type | Why it exists |
|---|---|---|
| reading_id | Utf8 | Identity of the fictional physical measurement. |
| measured_second | Int64 | Seconds after the exercise begins when the sensor measured. |
| delivered_second | Int64 | Seconds after the exercise begins when a network message arrived. |
| co2_ppm | Int64 | Invented CO₂ reading in parts per million; not a health assessment. |
Copy the query
WITH per_reading AS (
  SELECT reading_id, MIN(co2_ppm) AS co2_ppm
  FROM sensor_deliveries
  GROUP BY reading_id
),
delivery_summary AS (
  SELECT COUNT(*) AS deliveries, AVG(co2_ppm) AS delivered_mean_ppm
  FROM sensor_deliveries
),
measurement_summary AS (
  SELECT COUNT(*) AS measurements, AVG(co2_ppm) AS measurement_mean_ppm
  FROM per_reading
)
SELECT deliveries, measurements, delivered_mean_ppm, measurement_mean_ppm
FROM delivery_summary CROSS JOIN measurement_summary;
This read-only query is planned and executed against an empty typed table with Apache DataFusion 45.2.0. We review the synthetic sample output separately. Check field types, thresholds, and counting rules against your own data. Read the testing methodology.
Query result
Two grains, two averages
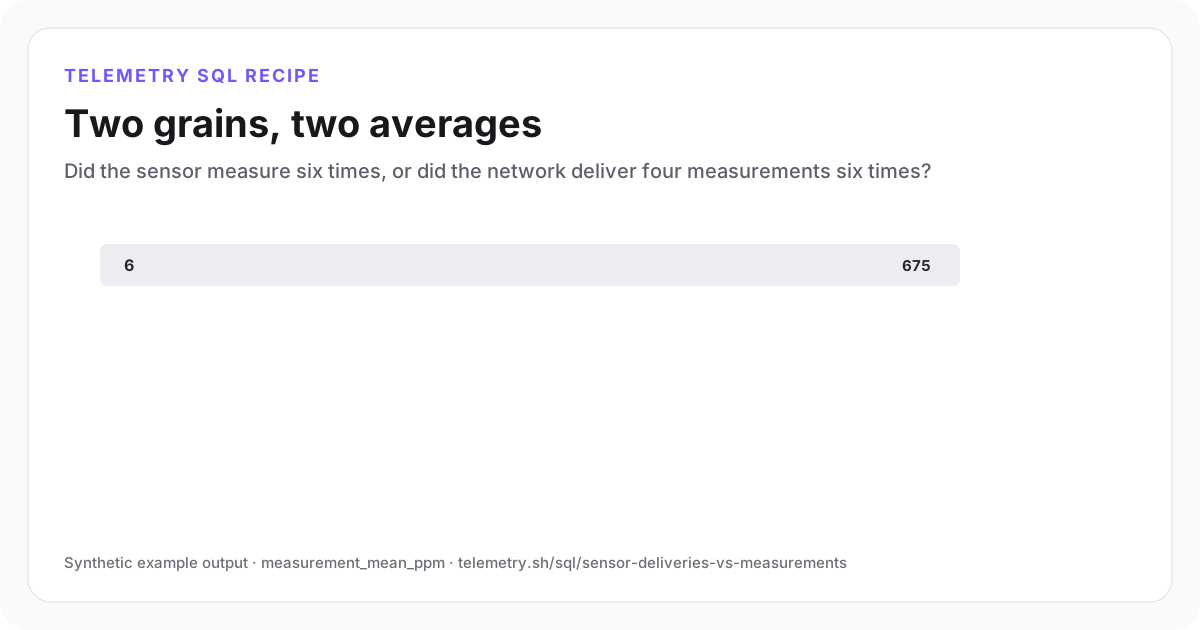
Six deliveries represent four measurements. Both averages use the same fictional values but answer different questions.
| deliveries | measurements | delivered_mean_ppm | measurement_mean_ppm |
|---|---|---|---|
| 6 | 4 | 700 | 675 |
Synthetic example output. Run the query against your own event schema and thresholds before using it for operational decisions.
Reproduce the example
Download the sample data
The JSON bundle includes the event schema with field types, reproducible input rows, exact SQL, expected output, review notes, and engine version. The CSV contains the displayed result.
How the SQL works
- 1The first CTE groups deliveries by reading_id, so a retry of r4 does not create another measurement.
- 2The delivered-row average is 700 ppm; the four-measurement average is 675 ppm. Neither is necessarily a time-weighted room average.
- 3MIN is safe only because this fictional fixture gives the same co2_ppm on every delivery of a reading_id. Check conflicting values before deduplicating real data.
Edge cases to check
- Two different measurements can share the same numeric CO₂ value. AVG(DISTINCT co2_ppm) would incorrectly merge them.
- Real reading IDs can collide across devices or be reused after reboot. Define an identity contract before grouping real events.
- These invented CO₂ values cannot support a ventilation or health decision. Real use needs calibration, placement, missing-reading and time-coverage checks.
Recommended dashboard
- Table: deliveries, measurements and the two averages for a selected lesson run
Alert guidance
This fictional teaching fixture is not suitable for a real-world CO₂ alert.
Read alert setupSet up the events this query needs
Related instrumentation and guides
Continue the analysis
Measure event ingestion freshness
Find event sources that stopped delivering data or are arriving substantially later than they occurred.
Open recipeFind duplicate event ids
Identify event identifiers delivered more than once and measure whether duplicate handling is working.
Open recipeMeasure required-field null rate
Find event contracts where a required account, status, or correlation field is disappearing.
Open recipeRun it on your events
Create a table, adapt the fields, and save the result
Start free, send structured events, and use the query result as a chart, shared dashboard widget, or alert input.
Telemetry’s current terms require account creators to be over 18. Younger students can use the printable activity without creating an account. Terms of Service