Event schema
Fields the query expects
| Field | Type | Why it exists |
|---|---|---|
| timestamp_utc | Timestamp | Resource completion time. |
| resource_host | Utf8 | Approved hostname without path or query values. |
| resource_type | Utf8 | script, stylesheet, image, fetch, or another bounded class. |
| duration_ms | Float64 | Resource duration. |
| transfer_bytes | Int64 | Transferred response bytes when available. |
| status | Utf8 | success, failed, or blocked. |
Copy the query
SELECT
  resource_host,
  resource_type,
  COUNT(*) AS resources,
  approx_percentile_cont(duration_ms, 0.95) AS p95_duration_ms,
  SUM(transfer_bytes) AS transfer_bytes,
  SUM(CASE WHEN status <> 'success' THEN 1 ELSE 0 END) AS failures
FROM frontend_resource_events
WHERE timestamp_utc >= now() - INTERVAL '24 hours'
GROUP BY resource_host, resource_type
HAVING COUNT(*) >= 20
ORDER BY p95_duration_ms DESC, failures DESC;
This read-only query is planned and executed against an empty typed table with Apache DataFusion 45.2.0. We review the synthetic sample output separately. Check field types, thresholds, and counting rules against your own data. Read the testing methodology.
Query result
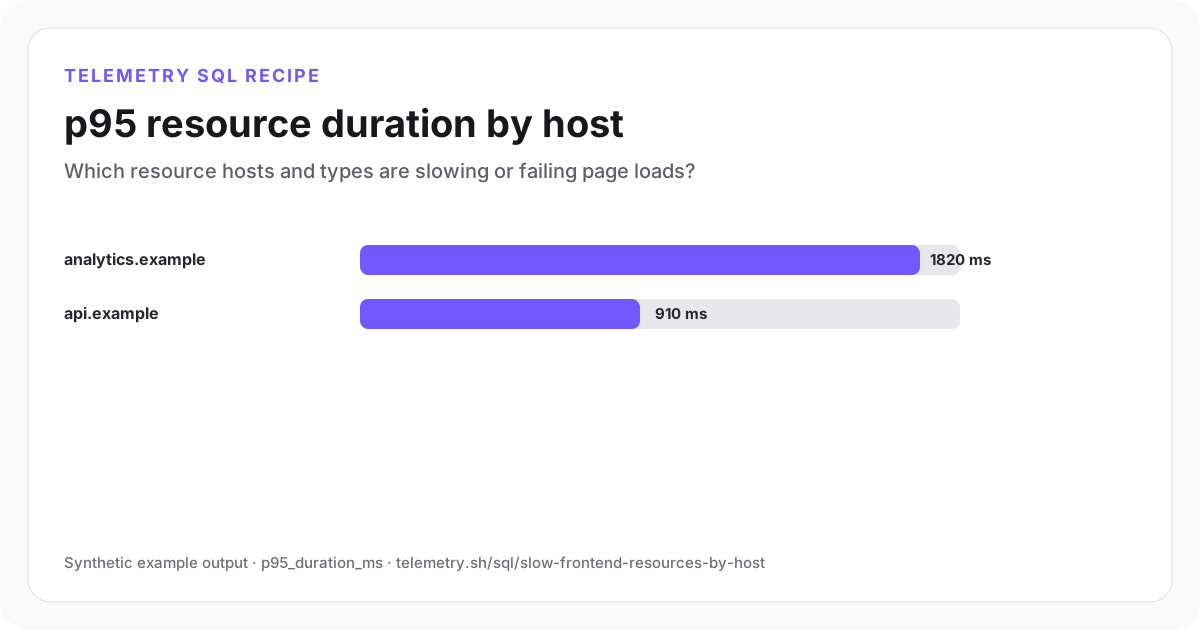
p95 resource duration by host
The analytics script is slower and fails more often than the first-party fetch group.
| resource_host | resource_type | resources | p95_duration_ms | transfer_bytes | failures |
|---|---|---|---|---|---|
| analytics.example | script | 2,140 | 1,820 | 68,480,000 | 42 |
| api.example | fetch | 8,210 | 910 | 124,200,000 | 18 |
Synthetic example output. Run the query against your own event schema and thresholds before using it for operational decisions.
Reproduce the example
Download the sample data
The JSON bundle includes the event schema with field types, illustrative input rows, exact SQL, expected output, review notes, and engine version. The CSV contains the displayed result.
How the SQL works
- 1Host and type preserve ownership without storing full resource URLs.
- 2High p95 duration shows that some third-party requests are slow even when most finish sooner.
- 3Compare transferred bytes with duration to check whether larger responses explain the slowdown.
Edge cases to check
- Cross-origin timing detail depends on browser policy.
- Cached resources require separate interpretation.
- Never store signed URLs, query strings, or user-specific paths.
Recommended dashboard
- Bars: p95_duration_ms by host
- Trend: failures by resource type
- Table: transfer_bytes by approved host
Alert guidance
Alert when a critical first-party host fails or a reviewed third-party p95 crosses its budget.
Read alert setupSet up the events this query needs
Related instrumentation and guides
Continue the analysis
Calculate p50, p95, and p99 API latency
Compare median and tail latency by endpoint with DataFusion-compatible percentile SQL.
Open recipeCompare Core Web Vitals by route and release
Compare LCP, INP, and CLS samples by stable route and release while keeping the percentage of passing samples visible.
Open recipeRank JavaScript errors by route and release
Find frontend releases and routes with the most repeated JavaScript failures and affected sessions.
Open recipeRun it on your events
Create a table, adapt the fields, and save the result
Start free, send structured events, and use the query result as a chart, shared dashboard widget, or alert input.