Event schema
Fields the query expects
| Field | Type | Why it exists |
|---|---|---|
| timestamp_utc | Timestamp | Measurement time in UTC. |
| route_template | Utf8 | Stable route template without user or query-string values. |
| release | Utf8 | Frontend release identifier. |
| metric_name | Utf8 | Controlled LCP, INP, or CLS metric name. |
| metric_value | Float64 | Metric value in its documented unit. |
| passed | Boolean | Whether the sample passed the product's versioned threshold. |
| environment | Utf8 | Deployment environment. |
Copy the query
SELECT
  route_template,
  release,
  COUNT(*) AS samples,
  AVG(CASE WHEN metric_name = 'LCP' THEN metric_value ELSE NULL END) AS avg_lcp_ms,
  AVG(CASE WHEN metric_name = 'INP' THEN metric_value ELSE NULL END) AS avg_inp_ms,
  AVG(CASE WHEN metric_name = 'CLS' THEN metric_value ELSE NULL END) AS avg_cls,
  100.0 * SUM(CASE WHEN passed THEN 1 ELSE 0 END)
    / NULLIF(COUNT(*), 0) AS passing_samples_pct
FROM frontend_vital_events
WHERE timestamp_utc >= now() - INTERVAL '7 days'
  AND environment = 'production'
GROUP BY route_template, release
ORDER BY passing_samples_pct ASC, route_template, release;
This read-only query is planned and executed against an empty typed table with Apache DataFusion 45.2.0. We review the synthetic sample output separately. Check field types, thresholds, and counting rules against your own data. Read the testing methodology.
Query result
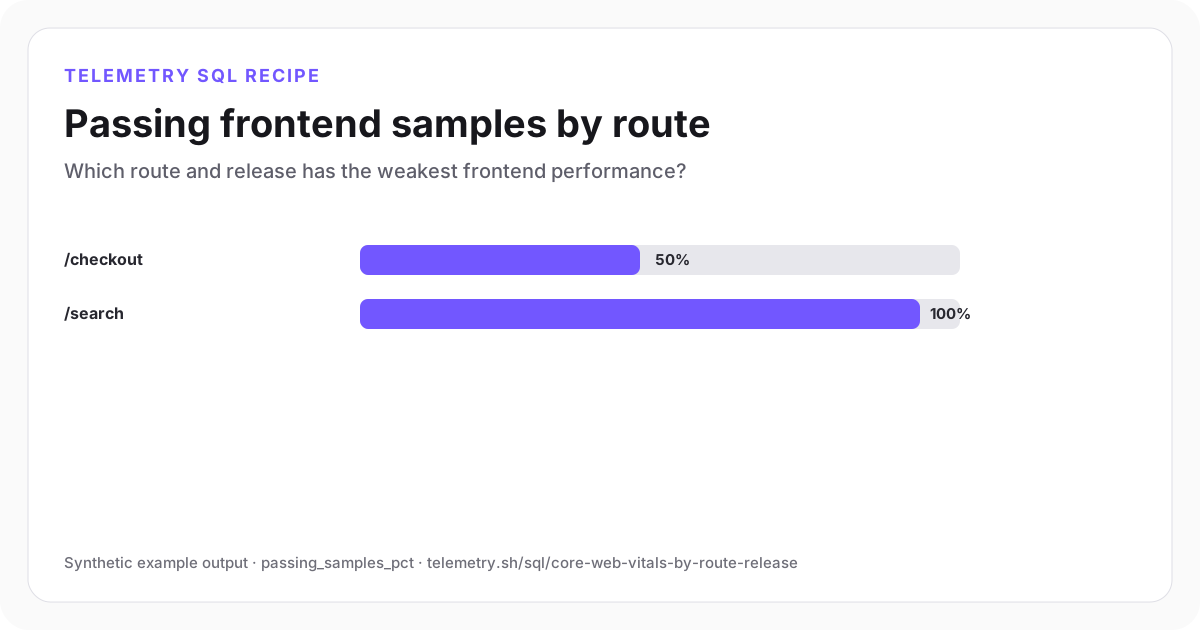
Passing frontend samples by route
Checkout passes half of its synthetic LCP, INP, and CLS samples; search passes all samples.
| route_template | release | samples | avg_lcp_ms | avg_inp_ms | avg_cls | passing_samples_pct |
|---|---|---|---|---|---|---|
| /checkout | web-102 | 6 | 2,800 | 220 | 0.1 | 50 |
| /search | web-102 | 6 | 1,850 | 120 | 0.05 | 100 |
Synthetic example output. Run the query against your own event schema and thresholds before using it for operational decisions.
Reproduce the example
Download the sample data
The JSON bundle includes the event schema with field types, reproducible input rows, exact SQL, expected output, review notes, and engine version. The CSV contains the displayed result.
How the SQL works
- 1Route templates prevent one chart series per raw URL or customer identifier.
- 2The release dimension turns a performance change into a deploy-scoped investigation.
- 3Metric-specific averages remain beside a single passing-sample summary so reviewers can see which vital moved.
Edge cases to check
- Use reviewed metric-specific thresholds and record their version when definitions change.
- Compare device classes and regions only when each group has enough samples to interpret its percentiles.
- Prefer percentiles over averages for production experience reporting when the SQL engine and sample volume permit it.
Recommended dashboard
- Bars: passing_samples_pct by route and release
- Trends: LCP, INP, and CLS by complete day
- Table: routes with sample count and release change
Alert guidance
Alert only when sample volume is sufficient and a route remains below its reviewed performance target for complete buckets.
Read alert setupSet up the events this query needs
Related instrumentation and guides
Define the source data
Event schemas for this analysis
Continue the analysis
Rank JavaScript errors by route and release
Find frontend releases and routes with the most repeated JavaScript failures and affected sessions.
Open recipeMeasure SPA navigation latency by route
Compare typical and tail client-side navigation time by destination route and frontend release.
Open recipeCalculate browser long-task rate by route
Measure main-thread blocking events and their total blocked time by route and frontend release.
Open recipeRun it on your events
Create a table, adapt the fields, and save the result
Start free, send structured events, and use the query result as a chart, shared dashboard widget, or alert input.