Event schema
Fields the query expects
| Field | Type | Why it exists |
|---|---|---|
| timestamp_utc | Timestamp | Request completion time in UTC. |
| route_template | Utf8 | Bounded route template, never the raw URL. |
| status_code | Int64 | HTTP response status. |
| environment | Utf8 | Deployment environment. |
Copy the query
SELECT
  route_template,
  COUNT(*) AS requests,
  SUM(CASE WHEN status_code >= 500 THEN 1 ELSE 0 END) AS errors,
  60.0 * COUNT(*) / NULLIF(
    date_part('epoch', MAX(timestamp_utc) - MIN(timestamp_utc)),
    0
  ) AS requests_per_minute
FROM api_throughput_events
WHERE timestamp_utc >= now() - INTERVAL '24 hours'
  AND environment = 'production'
GROUP BY route_template
ORDER BY requests_per_minute DESC, route_template;
This read-only query is planned and executed against an empty typed table with Apache DataFusion 45.2.0. We review the synthetic sample output separately. Check field types, thresholds, and counting rules against your own data. Read the testing methodology.
Query result
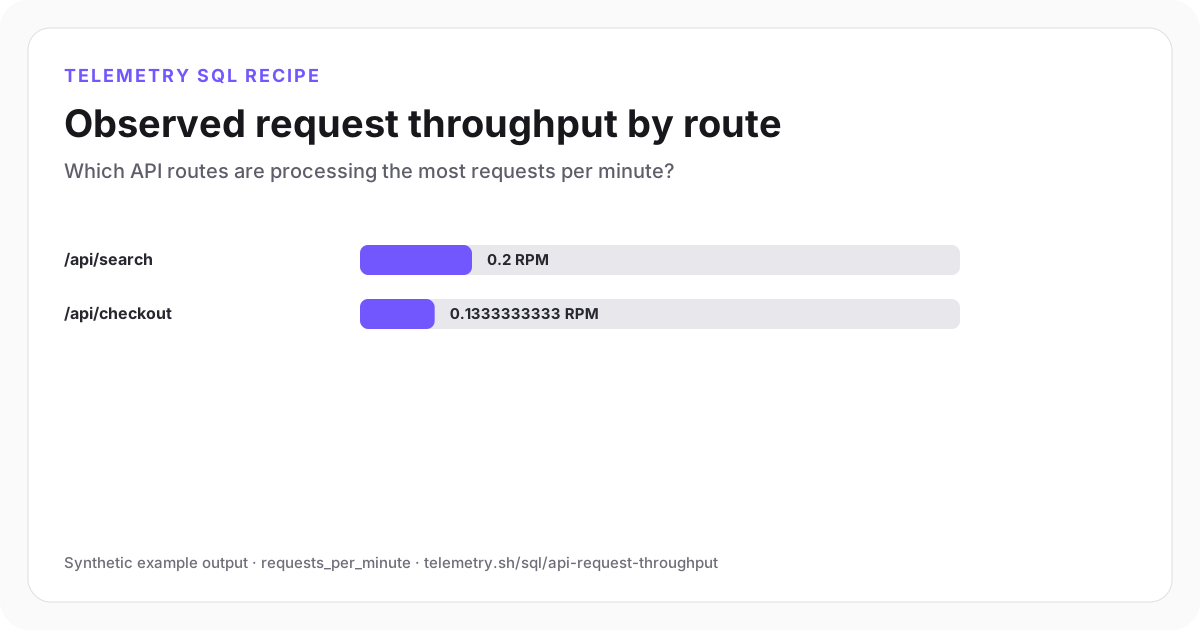
Observed request throughput by route
Search carries the highest observed request rate and also has a 5xx response to investigate.
| route_template | requests | errors | requests_per_minute |
|---|---|---|---|
| /api/search | 6 | 1 | 0.2 |
| /api/checkout | 4 | 0 | 0.13 |
Synthetic example output. Run the query against your own event schema and thresholds before using it for operational decisions.
Reproduce the example
Download the sample data
The JSON bundle includes the event schema with field types, reproducible input rows, exact SQL, expected output, review notes, and engine version. The CSV contains the displayed result.
How the SQL works
- 1Grouping on a controlled route template avoids one series per resource identifier or query string.
- 2The denominator uses the observed span for each route, which is safer for sparse routes than dividing by the whole lookback window.
- 3Keep error count beside error rate for each group so you can compare traffic changes with reliability.
Edge cases to check
- For production charts, aggregate into complete fixed time buckets so adjacent periods are directly comparable.
- A route with one request has no observed span; NULLIF returns null instead of inventing a rate.
- Separate internal health checks and synthetic traffic if they would distort customer demand.
Recommended dashboard
- Trend: requests per minute in complete five-minute buckets
- Bars: requests_per_minute by route_template
- Overlay: error rate and deployment markers
Alert guidance
Alert on sustained deviation from a reviewed baseline, not on a single high-volume route.
Read alert setupSet up the events this query needs
Related instrumentation and guides
Continue the analysis
Calculate API error rate by route
Rank API routes by 5xx error rate. Exclude routes with fewer than 20 requests so one failure does not dominate the results.
Open recipeCalculate p50, p95, and p99 API latency
Compare median and tail latency by endpoint with DataFusion-compatible percentile SQL.
Open recipeCalculate API error-budget burn rate
Turn hourly request failures into an SLO burn-rate series that shows how quickly the allowed error budget is being consumed.
Open recipeRun it on your events
Create a table, adapt the fields, and save the result
Start free, send structured events, and use the query result as a chart, shared dashboard widget, or alert input.