Event schema
Fields the query expects
| Field | Type | Why it exists |
|---|---|---|
| timestamp_utc | Timestamp | Month-end snapshot time. |
| account_id | Utf8 | Stable billing account identifier. |
| starting_mrr_usd | Float64 | MRR at the beginning of the measurement month. |
| ending_mrr_usd | Float64 | MRR at the end of the measurement month. |
Copy the query
SELECT
  date_trunc('month', timestamp_utc) AS month,
  COUNT(*) AS starting_accounts,
  SUM(starting_mrr_usd) AS starting_mrr_usd,
  SUM(ending_mrr_usd) AS ending_mrr_usd,
  100.0 * SUM(ending_mrr_usd)
    / NULLIF(SUM(starting_mrr_usd), 0) AS net_revenue_retention_pct,
  100.0 * SUM(CASE
    WHEN ending_mrr_usd < 0.0 THEN 0.0
    WHEN ending_mrr_usd > starting_mrr_usd THEN starting_mrr_usd
    ELSE ending_mrr_usd
  END) / NULLIF(SUM(starting_mrr_usd), 0)
    AS gross_revenue_retention_pct
FROM account_mrr_snapshots
WHERE timestamp_utc >= now() - INTERVAL '12 months'
  AND starting_mrr_usd > 0.0
GROUP BY date_trunc('month', timestamp_utc)
ORDER BY month;
This read-only query is planned and executed against an empty typed table with Apache DataFusion 45.2.0. We review the synthetic sample output separately. Check field types, thresholds, and counting rules against your own data. Read the testing methodology.
Query result
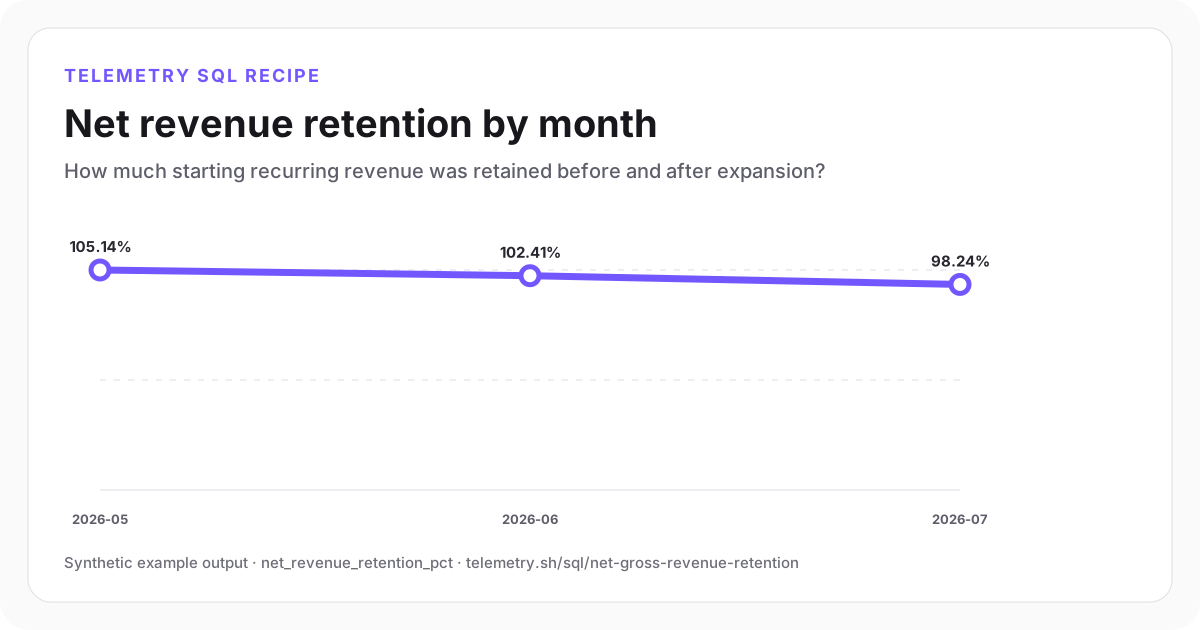
Net revenue retention by month
Expansion kept NRR above 100% in May and June, while declining GRR shows increasing contraction or churn underneath.
2026-05
105.14%
2026-06
102.41%
2026-07
98.24%
| month | starting_accounts | starting_mrr_usd | ending_mrr_usd | net_revenue_retention_pct | gross_revenue_retention_pct |
|---|---|---|---|---|---|
| 2026-05 | 418 | 126,400 | 132,900 | 105.14 | 96.44 |
| 2026-06 | 431 | 132,900 | 136,100 | 102.41 | 94.88 |
| 2026-07 | 446 | 136,100 | 133,700 | 98.24 | 93.31 |
Synthetic example output. Run the query against your own event schema and thresholds before using it for operational decisions.
Reproduce the example
Download the sample data
The JSON bundle includes the event schema with field types, illustrative input rows, exact SQL, expected output, review notes, and engine version. The CSV contains the displayed result.
How the SQL works
- 1Only accounts with starting MRR enter the denominator, keeping new business outside retention.
- 2NRR compares total ending MRR with starting MRR and therefore includes expansion.
- 3GRR caps every account at its starting MRR, so expansion cannot offset contraction or churn.
Edge cases to check
- Normalize annual, usage-based, and multi-currency contracts before taking snapshots.
- Use one account hierarchy consistently when parent and child subscriptions can move independently.
- Reconcile backdated billing corrections so historical snapshots do not drift silently.
Recommended dashboard
- Trend: NRR and GRR by month
- Bars: expansion, contraction, and churn MRR
- Table: largest account-level revenue changes
Alert guidance
Review a complete month when GRR or NRR falls below its operating range; do not alert on an incomplete current-month snapshot.
Read alert setupSet up the events this query needs
Related instrumentation and guides
Continue the analysis
Measure churn and reactivation by cohort
Classify accounts as retained, churned, or reactivated from recurring meaningful product activity.
Open recipeCalculate trial-to-paid conversion
Measure how many trial accounts become paid customers within a fixed conversion window.
Open recipeMeasure payment-failure recovery
Calculate how often failed invoices are recovered by a later successful payment attempt.
Open recipeRun it on your events
Create a table, adapt the fields, and save the result
Start free, send structured events, and use the query result as a chart, shared dashboard widget, or alert input.