Event schema
Fields the query expects
| Field | Type | Why it exists |
|---|---|---|
| timestamp_utc | Timestamp | Model request completion time. |
| model | Utf8 | Model identifier. |
| cache_outcome | Utf8 | hit, miss, or unavailable. |
| attempt | Int64 | One-based attempt number. |
| estimated_cost_usd | Float64 | Estimated request cost. |
Copy the query
SELECT
  model,
  COUNT(*) AS requests,
  SUM(CASE WHEN cache_outcome = 'hit' THEN 1 ELSE 0 END) AS cache_hits,
  SUM(CASE WHEN attempt > 1 THEN 1 ELSE 0 END) AS retries,
  100.0 * SUM(CASE WHEN cache_outcome = 'hit' THEN 1 ELSE 0 END)
    / NULLIF(COUNT(*), 0) AS cache_hit_rate_pct,
  SUM(CASE WHEN attempt > 1 THEN estimated_cost_usd ELSE 0 END) AS retry_cost_usd,
  SUM(estimated_cost_usd) AS total_cost_usd
FROM llm_requests
WHERE timestamp_utc >= now() - INTERVAL '30 days'
GROUP BY model
ORDER BY retry_cost_usd DESC;
This read-only query is planned and executed against an empty typed table with Apache DataFusion 45.2.0. We review the synthetic sample output separately. Check field types, thresholds, and counting rules against your own data. Read the testing methodology.
Query result
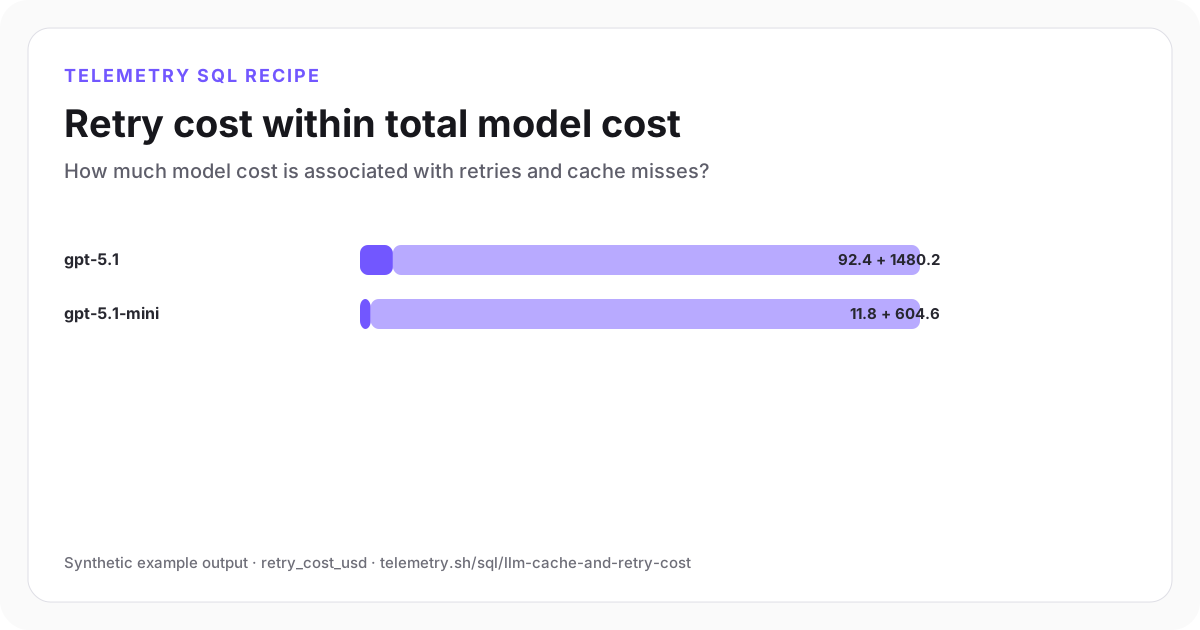
Retry cost within total model cost
The larger model has both the lower cache-hit rate and the larger retry-cost burden.
| model | requests | cache_hits | retries | cache_hit_rate_pct | retry_cost_usd | total_cost_usd |
|---|---|---|---|---|---|---|
| gpt-5.1 | 18,400 | 6,620 | 740 | 35.98 | 92.4 | 1,480.2 |
| gpt-5.1-mini | 49,200 | 23,810 | 380 | 48.39 | 11.8 | 604.6 |
Synthetic example output. Run the query against your own event schema and thresholds before using it for operational decisions.
Reproduce the example
Download the sample data
The JSON bundle includes the event schema with field types, illustrative input rows, exact SQL, expected output, review notes, and engine version. The CSV contains the displayed result.
How the SQL works
- 1Cache hit rate counts explicit cache hits within all recorded requests.
- 2Attempt greater than one isolates repeated model work from first-attempt cost.
- 3The result explains cost mechanics; connect it to accepted or retained outcomes before optimizing purely for spend.
Edge cases to check
- A provider-side prompt cache and an application response cache are different mechanisms.
- Avoid double-counting cost when one logical request emits both attempt and summary events.
- Cost estimates must use the price and token rules active when the request ran.
Recommended dashboard
- Stacked bars: retry and total cost by model
- Trend: cache-hit rate
- Table: features with expensive retry loops
Alert guidance
Alert on retry-cost spikes or sudden cache-hit collapse after minimum request volume.
Read alert setupSet up the events this query needs
Related instrumentation and guides
Continue the analysis
Calculate LLM cost by feature and model
Attribute model spend, tokens, request volume, and cost per request to product features.
Open recipeMeasure accepted AI outputs per dollar
Connect model spend to accepted, saved, or otherwise useful product outcomes.
Open recipeMeasure LLM time to first token
Compare streaming responsiveness and total generation latency by model and feature.
Open recipeRun it on your events
Create a table, adapt the fields, and save the result
Start free, send structured events, and use the query result as a chart, shared dashboard widget, or alert input.